Free Access
Fig. 2.
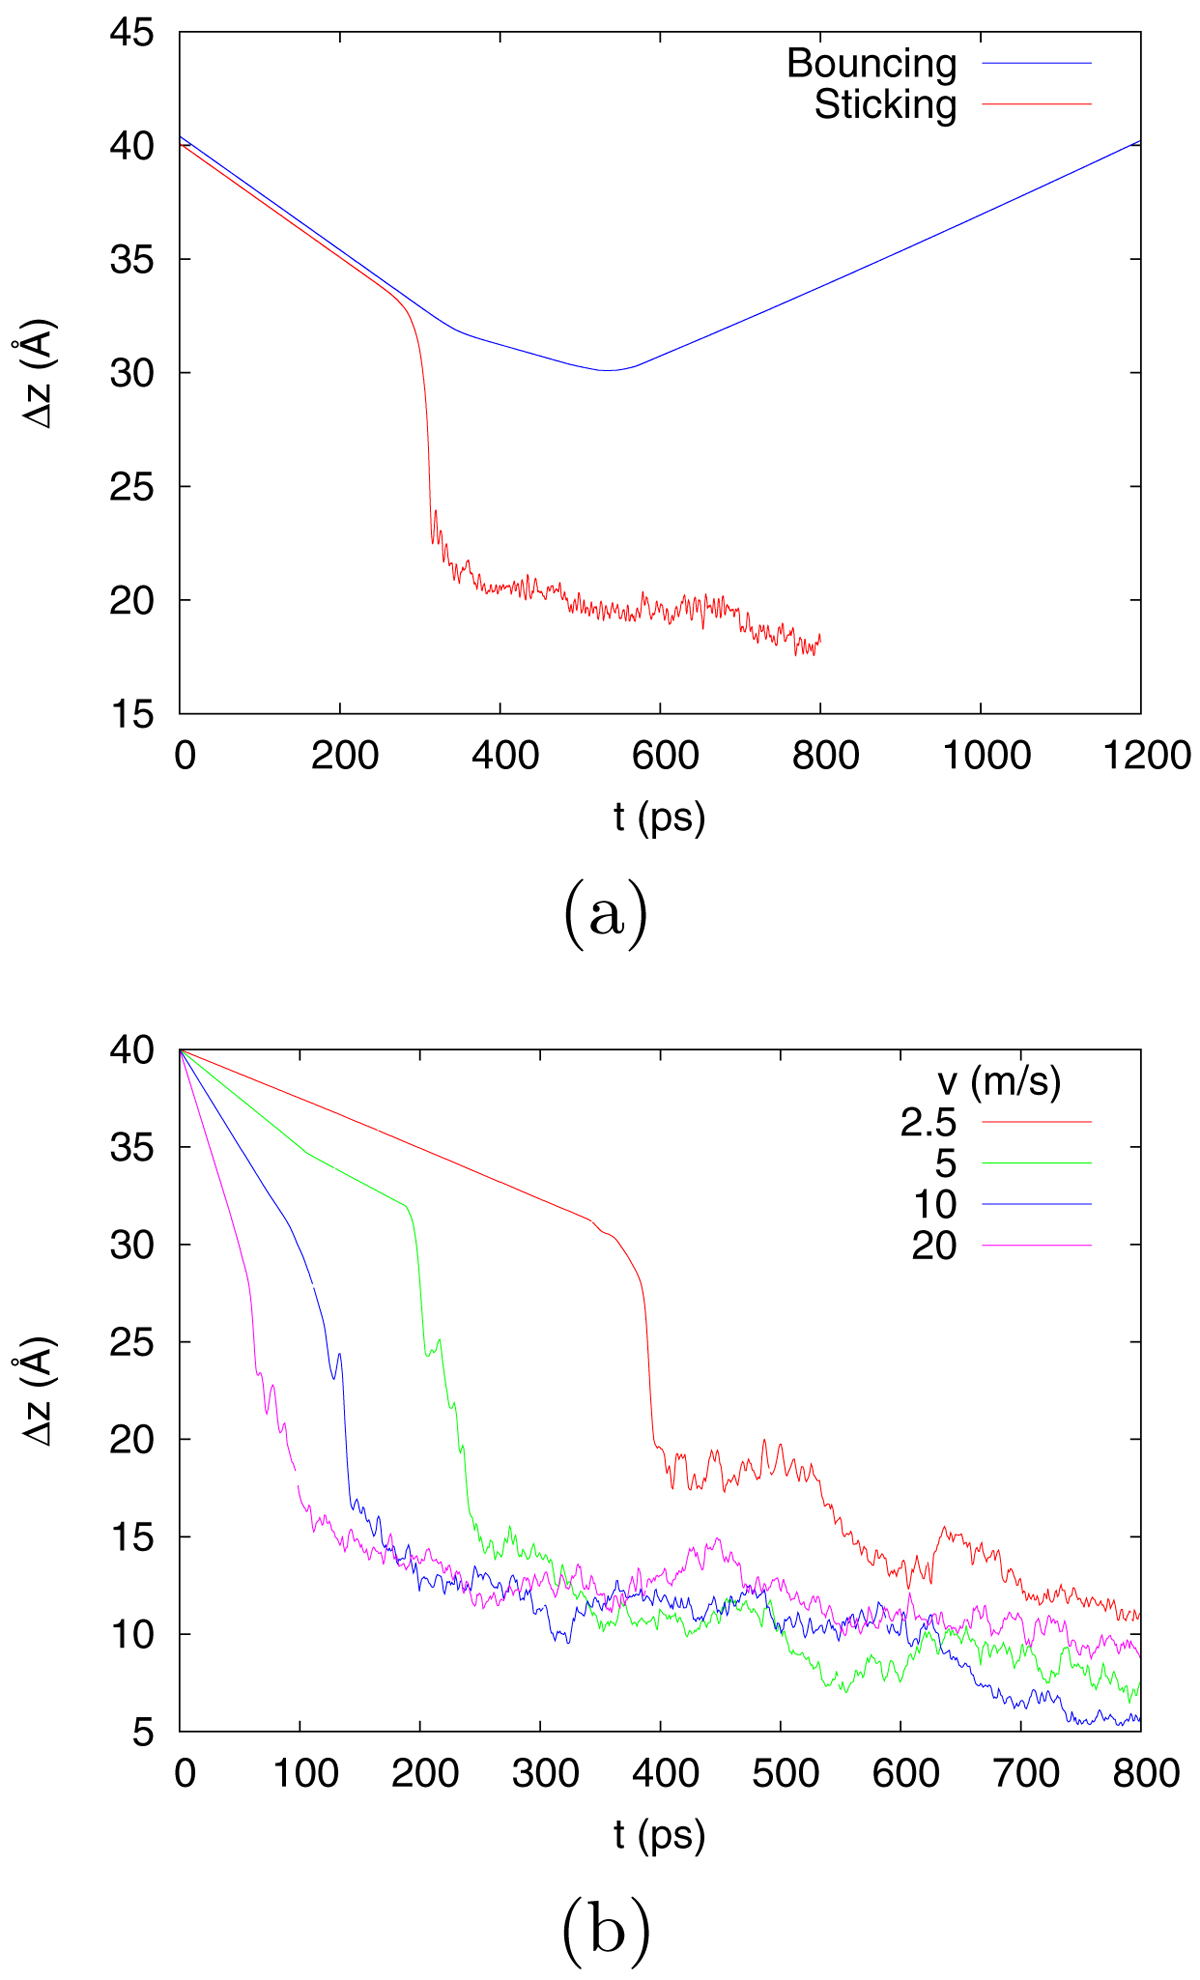
Temporal evolution of the center-of-mass distance, Δz. Panel a: data for a bouncing collision and a sticking collision at 100 K with a velocity of 2.5 m s−1. The trajectories correspond to the snapshots shown in Figs. 3b and c. Panel b: data for sticking collisions at 250 K for various velocities.
Current usage metrics show cumulative count of Article Views (full-text article views including HTML views, PDF and ePub downloads, according to the available data) and Abstracts Views on Vision4Press platform.
Data correspond to usage on the plateform after 2015. The current usage metrics is available 48-96 hours after online publication and is updated daily on week days.
Initial download of the metrics may take a while.