Fig. 9
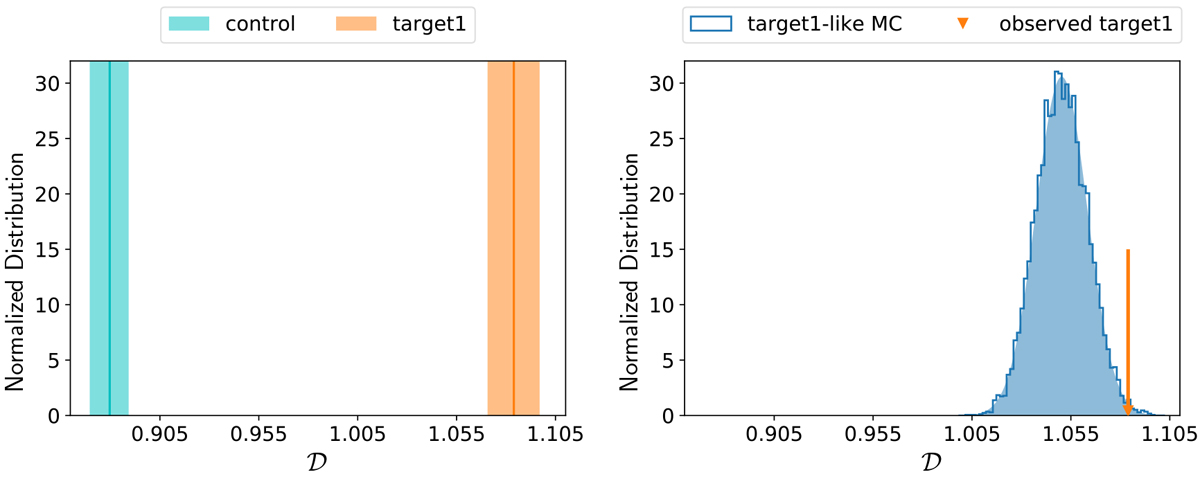
Left: rejecting Null Hypothesis I. Summary statistics of ![]() values obtained through 10 000 bootstrap resampling of control (cyan) and target1 (orange) samples. The means and one standard deviation are reprensented by the thick vertical lines and shaded area, respectively. Right: rejecting Null Hypothesis II. The blue histogram shows the distribution of
values obtained through 10 000 bootstrap resampling of control (cyan) and target1 (orange) samples. The means and one standard deviation are reprensented by the thick vertical lines and shaded area, respectively. Right: rejecting Null Hypothesis II. The blue histogram shows the distribution of
![]() values obtained through 10 000 resampling of control with weights that guarantee the same level of EVPA difference uncertainties in the resampled samples as in target1. The shaded blue distribution is a Gaussian fit to the histogram. The vertical orange arrow indicates the
values obtained through 10 000 resampling of control with weights that guarantee the same level of EVPA difference uncertainties in the resampled samples as in target1. The shaded blue distribution is a Gaussian fit to the histogram. The vertical orange arrow indicates the
![]() value computed for the observed full target1 sample. The examples shown in both panels make use of the PR3 polarizationmaps from which we have subtracted the smica CMB estimate. Results are consistent with all other implementations as shown in Tables 2 and 3.
value computed for the observed full target1 sample. The examples shown in both panels make use of the PR3 polarizationmaps from which we have subtracted the smica CMB estimate. Results are consistent with all other implementations as shown in Tables 2 and 3.
Current usage metrics show cumulative count of Article Views (full-text article views including HTML views, PDF and ePub downloads, according to the available data) and Abstracts Views on Vision4Press platform.
Data correspond to usage on the plateform after 2015. The current usage metrics is available 48-96 hours after online publication and is updated daily on week days.
Initial download of the metrics may take a while.