Fig. 8
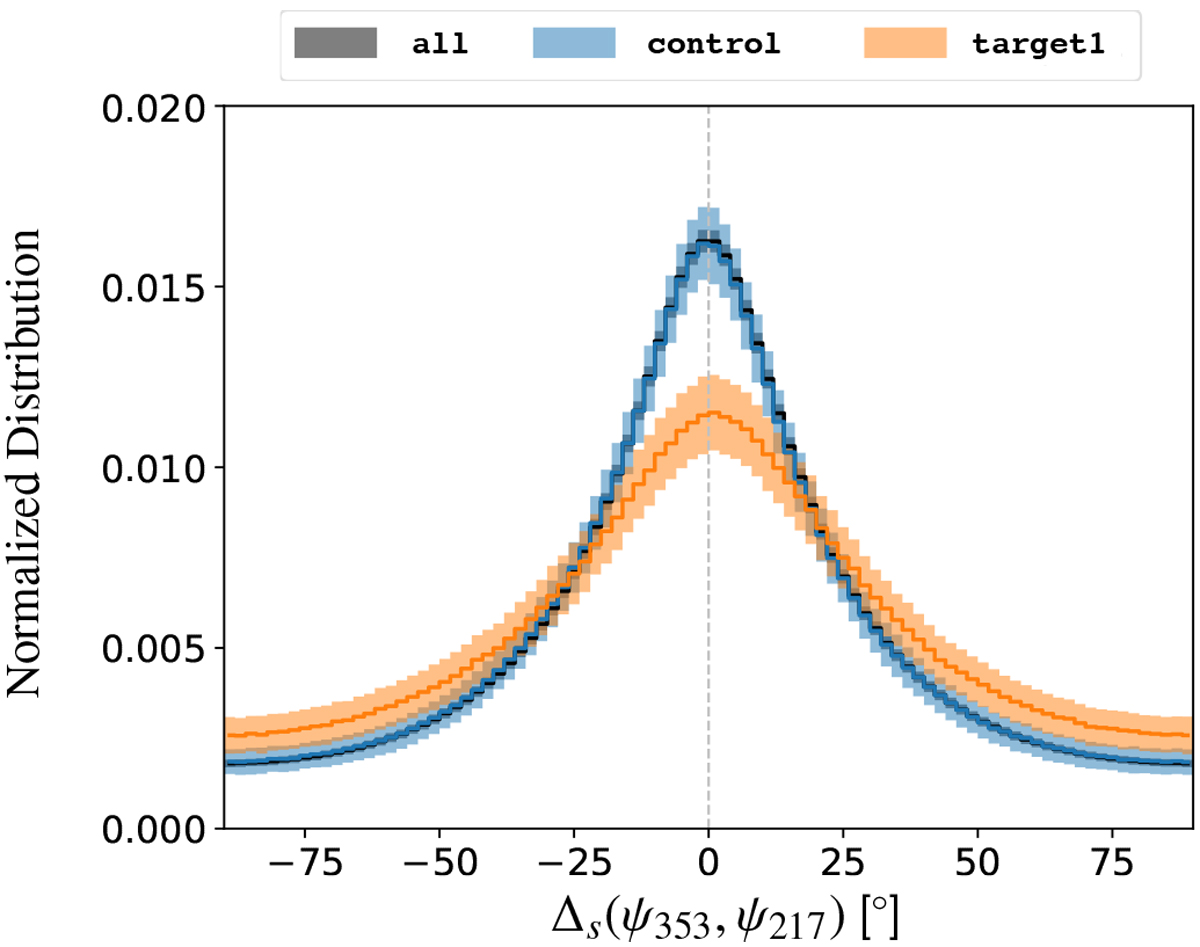
Normalized histograms of Δs(ψ353, ψ217) for the all, control, and target1 samples in black, blue, and orange, respectively. CMB has been subtracted from the PR3 maps using smica. The shaded area results from the propagation of observational uncertainties in Qν and Uν down to the computation of Δs(ψ353, ψ217). The shaded areas mark the plus and minus one standard deviation around the means obtained in each bin of width 2° through the MC simulations. Continuous lines show the means of the three samples.
Current usage metrics show cumulative count of Article Views (full-text article views including HTML views, PDF and ePub downloads, according to the available data) and Abstracts Views on Vision4Press platform.
Data correspond to usage on the plateform after 2015. The current usage metrics is available 48-96 hours after online publication and is updated daily on week days.
Initial download of the metrics may take a while.