Fig. 6
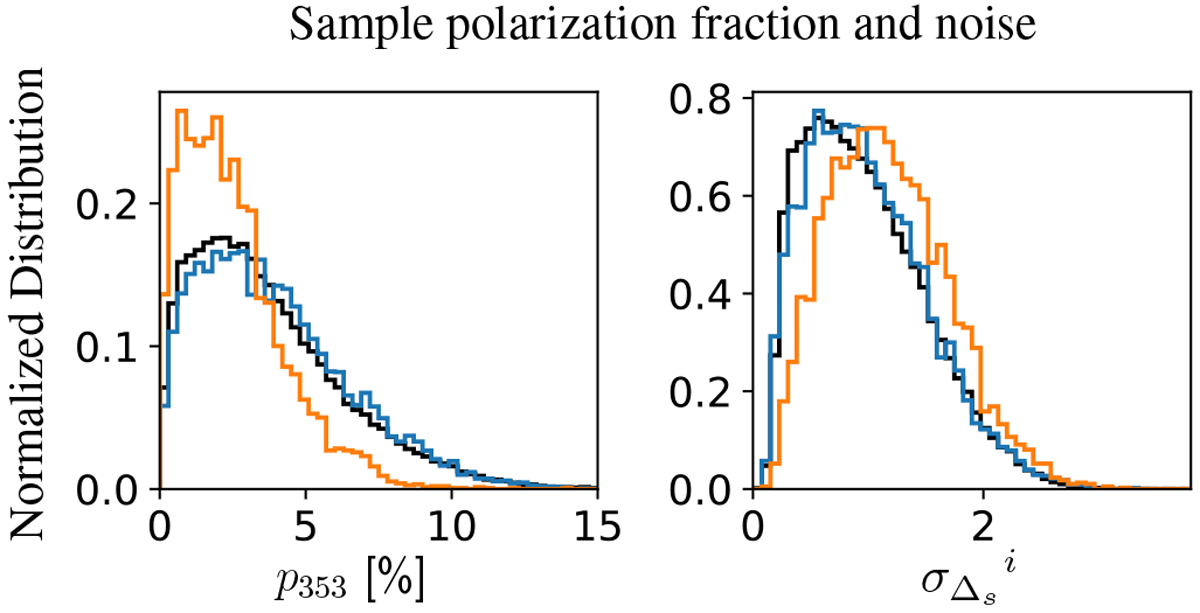
Histograms of polarization fraction at 353 GHz (left) and per-pixel inter-frequency uncertainty (![]() , Eq. (10)) (right), for all (black), control (blue), and target1 (orange). Histograms correspond to PR3 polarization maps with no CMB subtraction. The target1 sample is distinctly less polarized (left) and noisier (right) than all and control.
, Eq. (10)) (right), for all (black), control (blue), and target1 (orange). Histograms correspond to PR3 polarization maps with no CMB subtraction. The target1 sample is distinctly less polarized (left) and noisier (right) than all and control.
Current usage metrics show cumulative count of Article Views (full-text article views including HTML views, PDF and ePub downloads, according to the available data) and Abstracts Views on Vision4Press platform.
Data correspond to usage on the plateform after 2015. The current usage metrics is available 48-96 hours after online publication and is updated daily on week days.
Initial download of the metrics may take a while.