Fig. 5
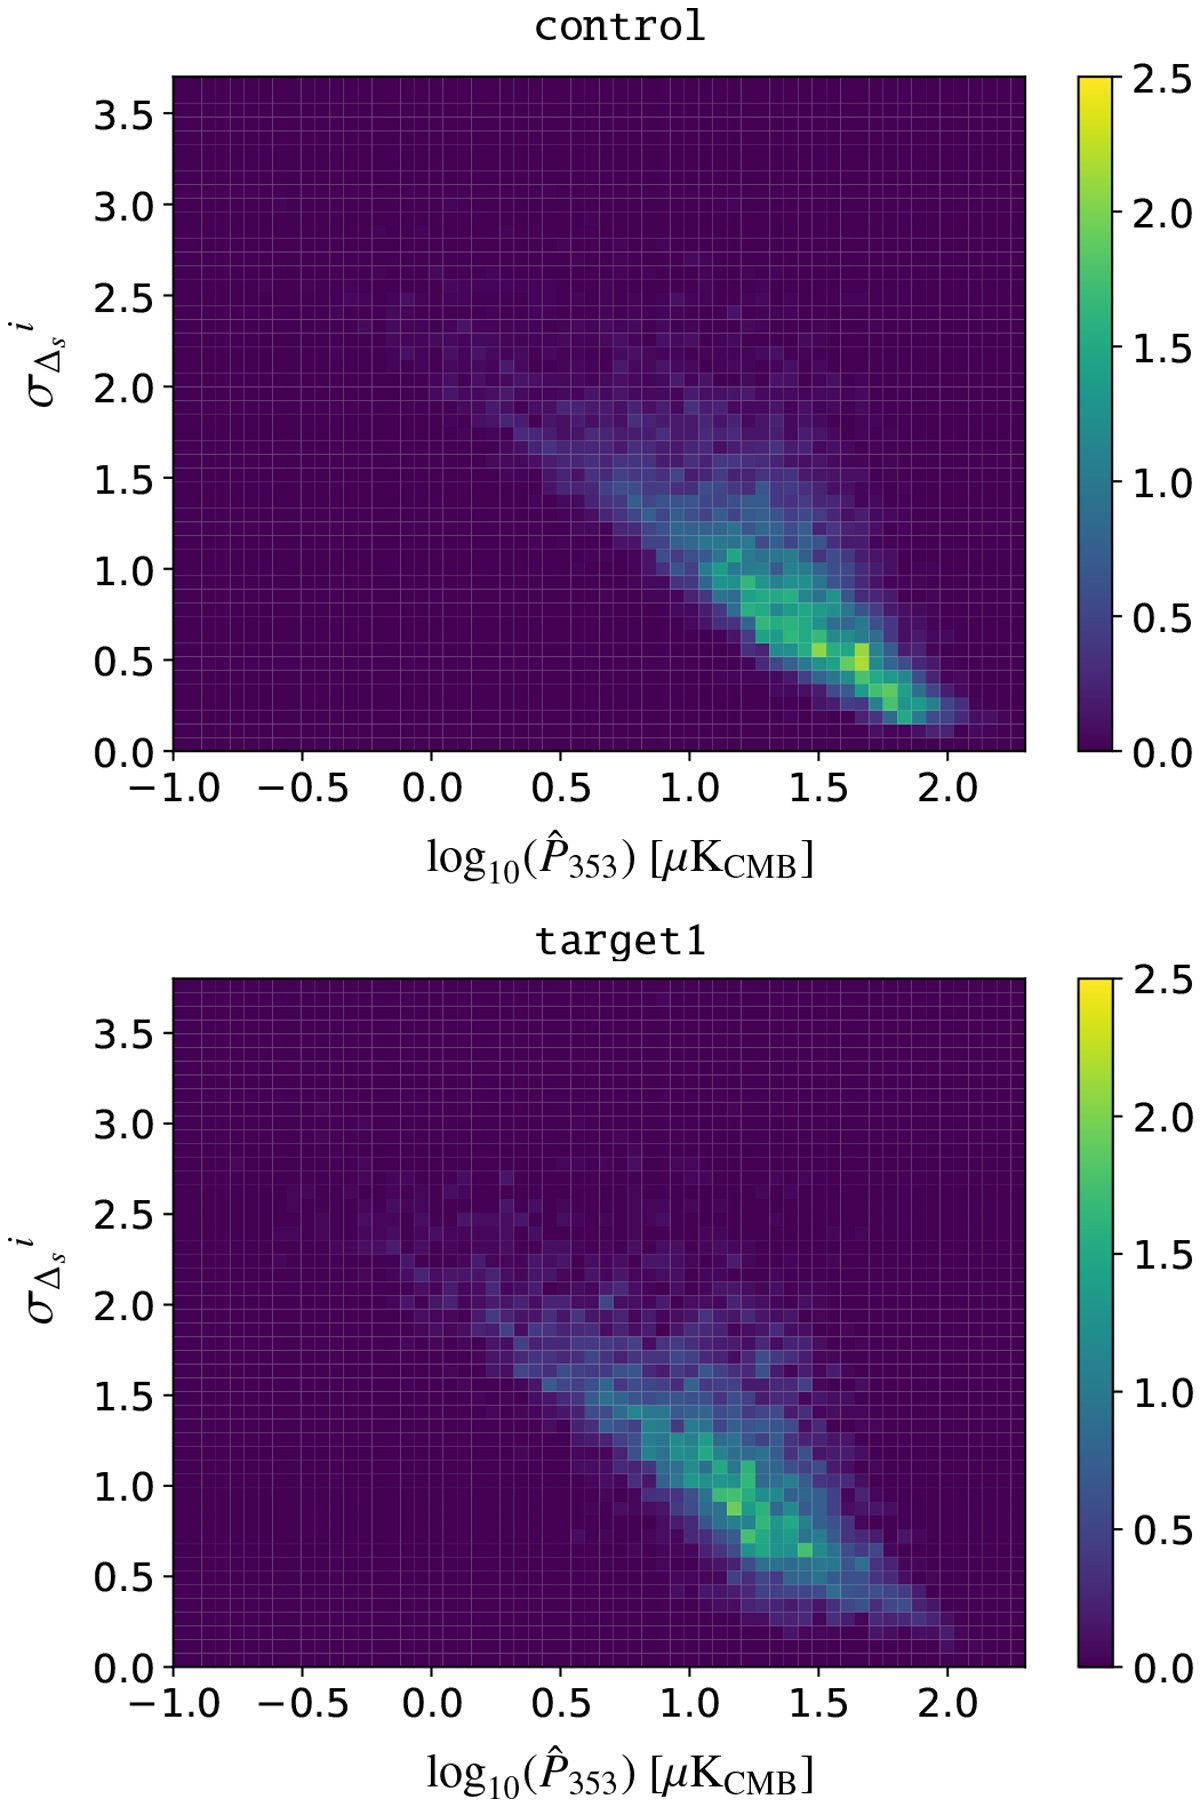
Two-dimensional normalized histograms of the uncertainties in EVPA differences (![]() ) and debiased polarized intensity at 353 GHz (
) and debiased polarized intensity at 353 GHz (![]() ) for the control sample (top) and the target1 sample (bottom) using PR3 maps with no CMB subtraction. Both histograms are normalized and bounded to the same color scale. The two quantities are correlated: target1 has noisier EVPA differences than control, because of the lower polarized intensities in its pixels.
) for the control sample (top) and the target1 sample (bottom) using PR3 maps with no CMB subtraction. Both histograms are normalized and bounded to the same color scale. The two quantities are correlated: target1 has noisier EVPA differences than control, because of the lower polarized intensities in its pixels.
Current usage metrics show cumulative count of Article Views (full-text article views including HTML views, PDF and ePub downloads, according to the available data) and Abstracts Views on Vision4Press platform.
Data correspond to usage on the plateform after 2015. The current usage metrics is available 48-96 hours after online publication and is updated daily on week days.
Initial download of the metrics may take a while.