Fig. 3
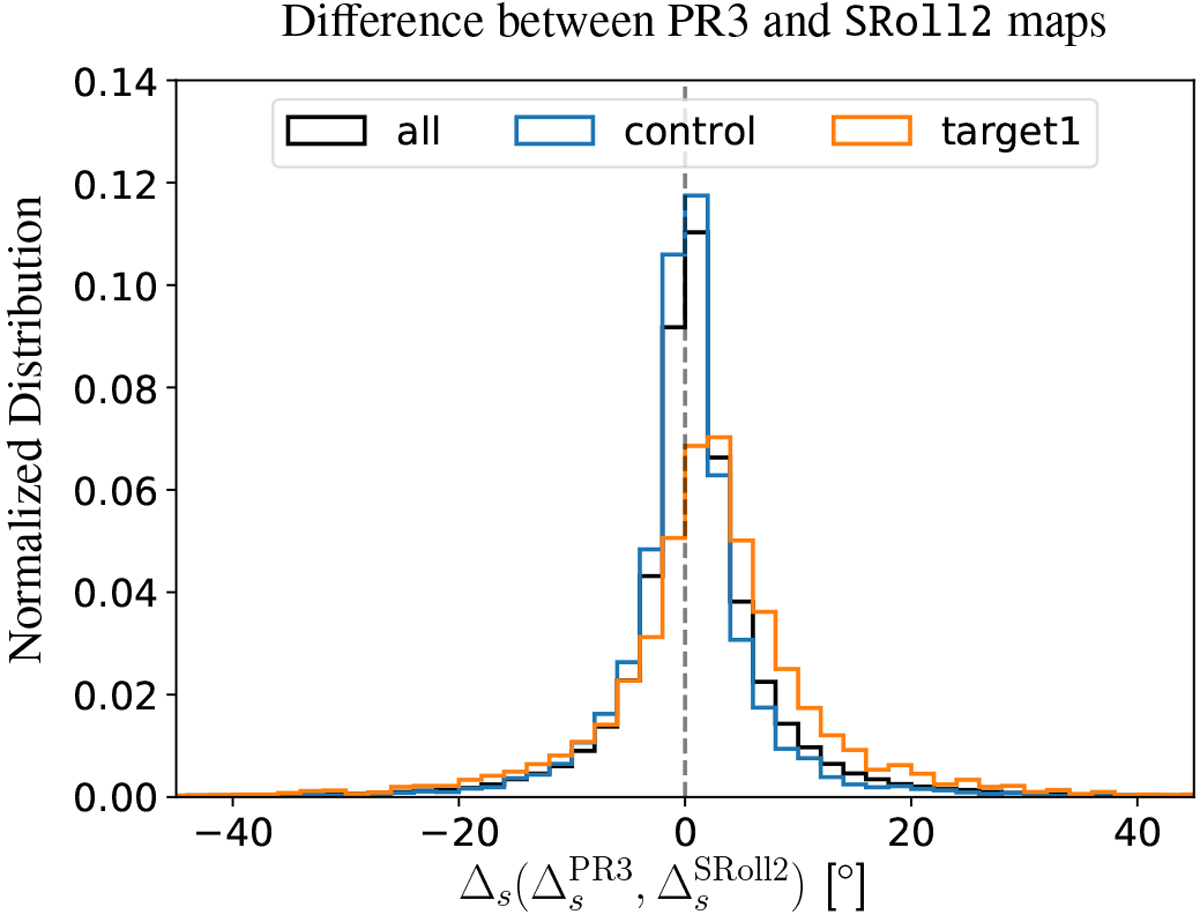
Normalized histogram of the difference between PR3 and SRoll2 maps of the EVPA difference between 353 and 217 GHz (![]() for sky pixels of all, control, and target1. For most pixels, the results agree within
~ ± 5°; however, pixels of target1 exhibit larger differences between map versions, centered at
2.3°. This suggests that the sky area covered by our target1 sample received more correction from the systematic cleaning. A similar picture is obtained considering target2 instead of target1.
for sky pixels of all, control, and target1. For most pixels, the results agree within
~ ± 5°; however, pixels of target1 exhibit larger differences between map versions, centered at
2.3°. This suggests that the sky area covered by our target1 sample received more correction from the systematic cleaning. A similar picture is obtained considering target2 instead of target1.
Current usage metrics show cumulative count of Article Views (full-text article views including HTML views, PDF and ePub downloads, according to the available data) and Abstracts Views on Vision4Press platform.
Data correspond to usage on the plateform after 2015. The current usage metrics is available 48-96 hours after online publication and is updated daily on week days.
Initial download of the metrics may take a while.