Fig. 2
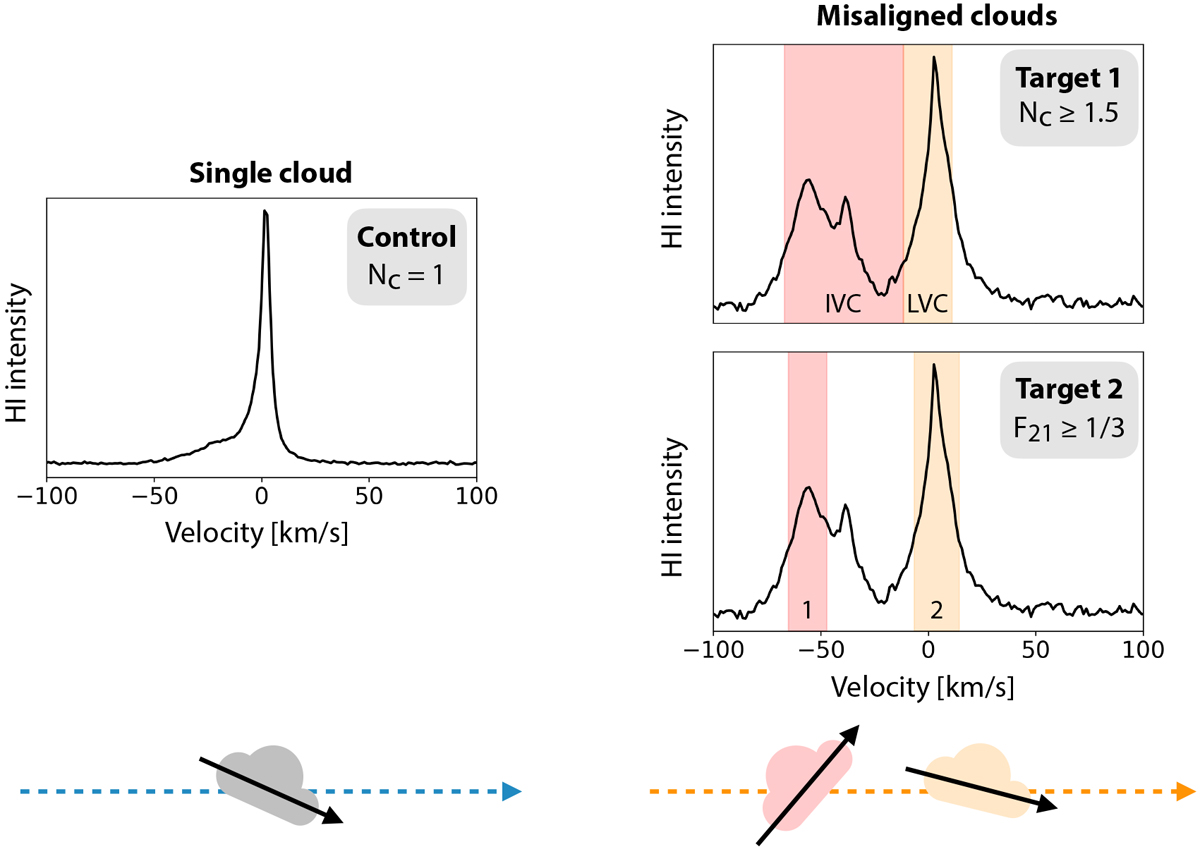
Cartoon illustration of the pixel selection described in Sect. 4.1.
Left panel: HI intensity spectrum of a representative pixel from our control group. The control sample targets sightlines defined by a single HI cloud, parameterized by
![]() .
Right panel: HI intensity spectrum of a representative pixel that is included in both target1 and target2. Pixels in the target samples are selected to have multiple HI clouds along the LOS, as parameterized by either
.
Right panel: HI intensity spectrum of a representative pixel that is included in both target1 and target2. Pixels in the target samples are selected to have multiple HI clouds along the LOS, as parameterized by either
![]() (target1) or
(target1) or ![]() (target2). HI orientations are determined for two clouds along each target LOS by summing the Clark & Hensley (2019) HI-based Stokes parameters over the indicated velocity ranges, and we require that the angles in these clouds differ by at least 60°. Cloud orientations in the target1 sample are determined from predefined IVC and LVC velocity ranges. Cloud orientations in the target2 sample are determined from the
1σ
velocity range around the two most prominent HI clouds identified in Panopoulou & Lenz (2020).
(target2). HI orientations are determined for two clouds along each target LOS by summing the Clark & Hensley (2019) HI-based Stokes parameters over the indicated velocity ranges, and we require that the angles in these clouds differ by at least 60°. Cloud orientations in the target1 sample are determined from predefined IVC and LVC velocity ranges. Cloud orientations in the target2 sample are determined from the
1σ
velocity range around the two most prominent HI clouds identified in Panopoulou & Lenz (2020).
Current usage metrics show cumulative count of Article Views (full-text article views including HTML views, PDF and ePub downloads, according to the available data) and Abstracts Views on Vision4Press platform.
Data correspond to usage on the plateform after 2015. The current usage metrics is available 48-96 hours after online publication and is updated daily on week days.
Initial download of the metrics may take a while.