Fig. 15
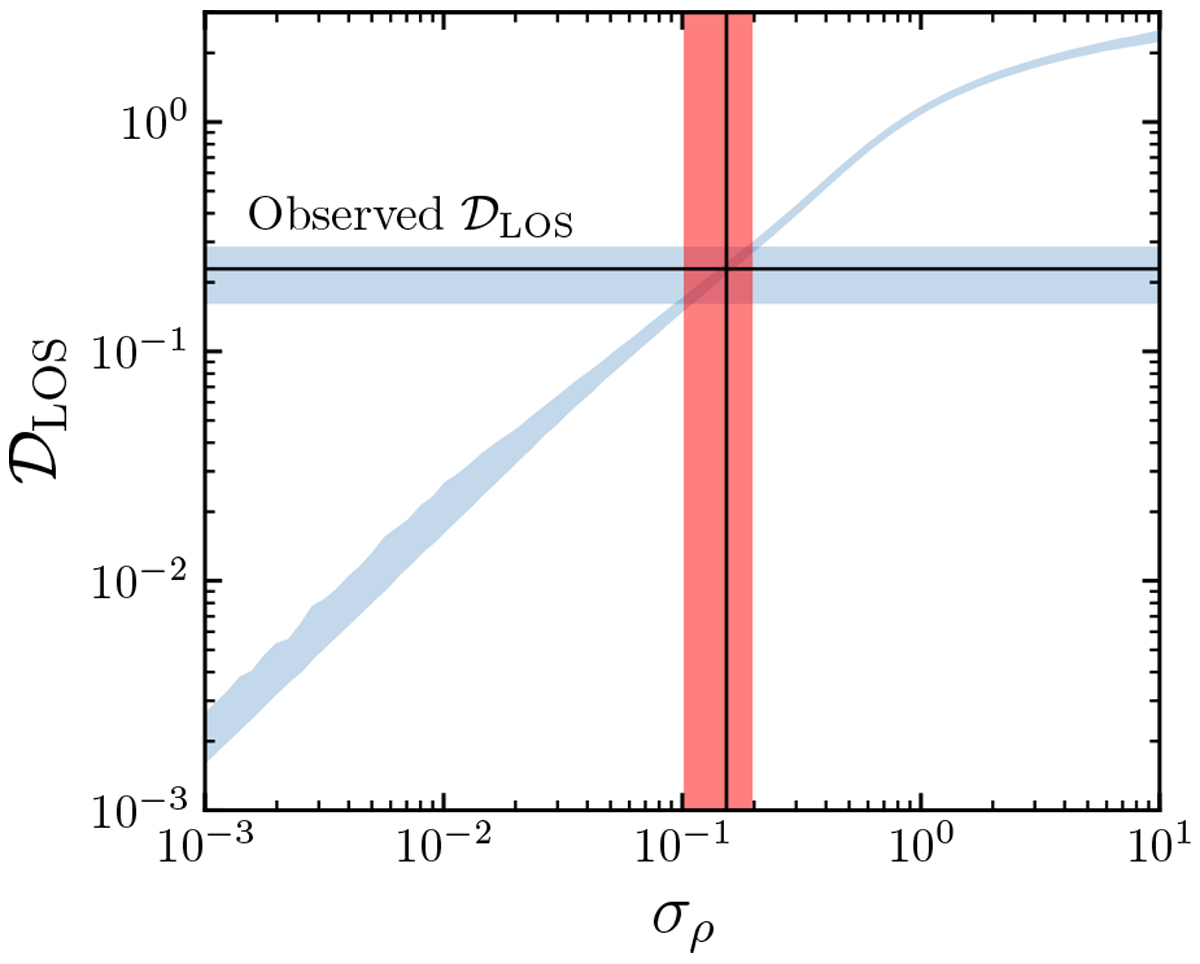
Dispersion ![]() (Eq. (18)) resulting solely from variations in the dust SEDs between two clouds along theLOS in the target2 sample. We quantify the level of SED variation by the parameter
σρ (Eq. (15)), finding that σρ = 0.15 can account for the excess dispersion in the target sample. Thus, we estimate that the ratio of 353 to 217 GHz polarized intensity is varying at roughly the 15% level from cloud to cloud. The blue shaded regions indicate the observed range of
(Eq. (18)) resulting solely from variations in the dust SEDs between two clouds along theLOS in the target2 sample. We quantify the level of SED variation by the parameter
σρ (Eq. (15)), finding that σρ = 0.15 can account for the excess dispersion in the target sample. Thus, we estimate that the ratio of 353 to 217 GHz polarized intensity is varying at roughly the 15% level from cloud to cloud. The blue shaded regions indicate the observed range of
![]() estimated in Sect. 4 and the ±1σ
confidence interval from 1000 realizations of γ1,
γ2 ,
ρ1 , and ρ2 in each pixel. The red shaded region is the resultant constraint on σρ.
estimated in Sect. 4 and the ±1σ
confidence interval from 1000 realizations of γ1,
γ2 ,
ρ1 , and ρ2 in each pixel. The red shaded region is the resultant constraint on σρ.
Current usage metrics show cumulative count of Article Views (full-text article views including HTML views, PDF and ePub downloads, according to the available data) and Abstracts Views on Vision4Press platform.
Data correspond to usage on the plateform after 2015. The current usage metrics is available 48-96 hours after online publication and is updated daily on week days.
Initial download of the metrics may take a while.