Fig. 14
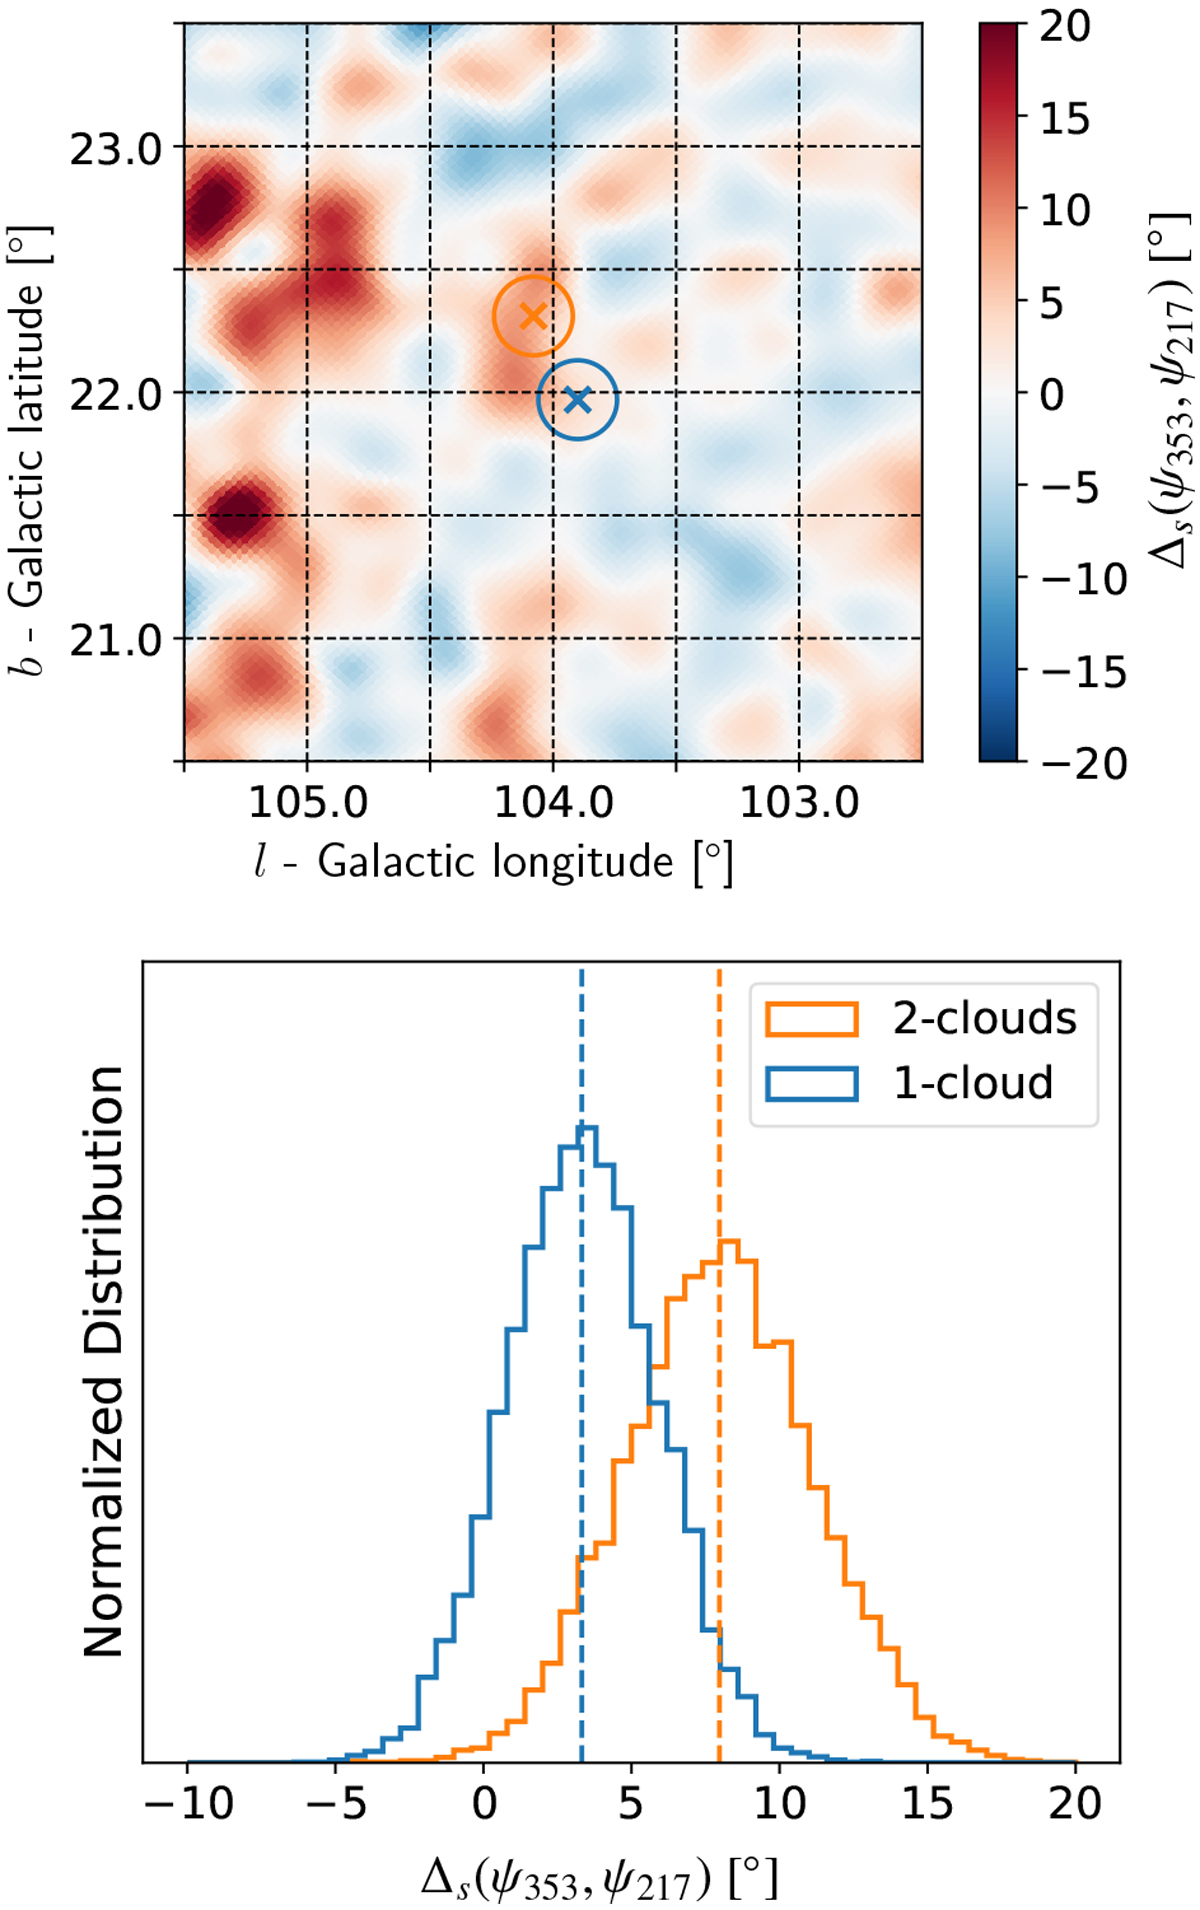
Tomography region of Panopoulou et al. (2019). Top panel: map of EVPA differences computed from 353 and 217 GHz polarization maps from Planck. The two-cloud and one-cloud sight lines are marked respectively by orange and blue crosses northeast and southwest of the map center. The circles have 16′ radius and mark the beams within which starlight polarization data have been taken and studied by Panopoulou et al. (2019). Bottom panel: histograms of EVPA differences computed through 10 000 MC simulations to propagate observational uncertainties on (Qν , Uν ). The two-cloud LOS histogram is shown in orange, the one-cloud LOS in blue. The vertical lines with corresponding colors show the EVPA differences from the data.
Current usage metrics show cumulative count of Article Views (full-text article views including HTML views, PDF and ePub downloads, according to the available data) and Abstracts Views on Vision4Press platform.
Data correspond to usage on the plateform after 2015. The current usage metrics is available 48-96 hours after online publication and is updated daily on week days.
Initial download of the metrics may take a while.