Fig. 11
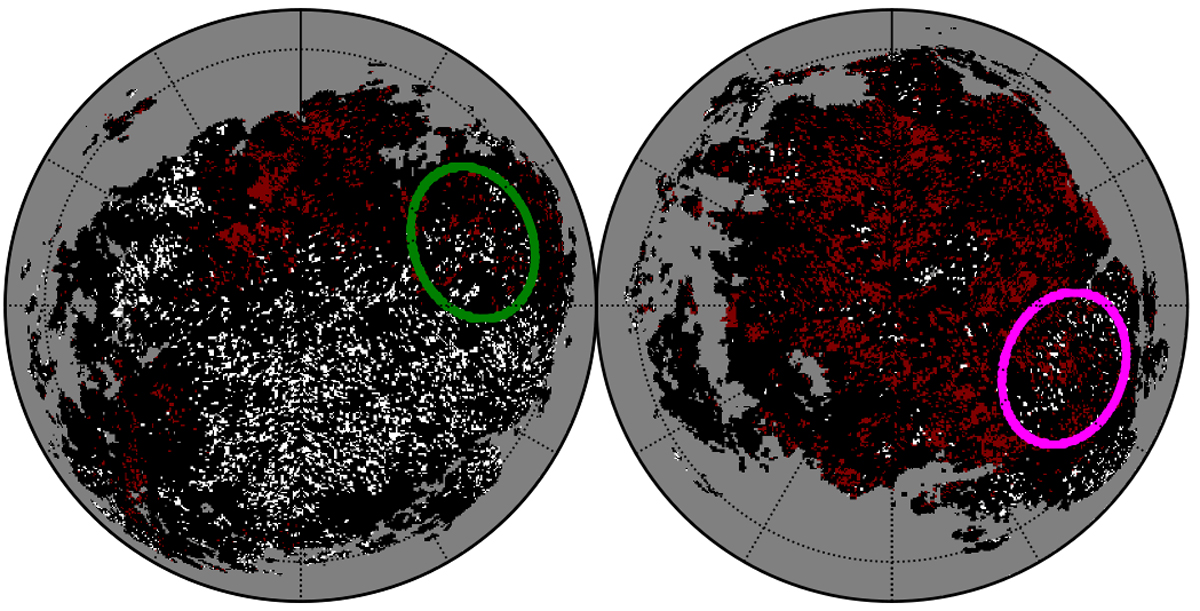
Map showing the location of sky pixels belonging to the target1 (white) and control (orange) samples. Black pixels are those in all but neither in target1 nor control. The gray area are pixels where
![]() has not be determined (see Panopoulou & Lenz 2020). The locations of the northern and southern sky patches studied in order to investigate the effect of target and control sampling different sky regions are shown with the green and magenta circles, respectively.
has not be determined (see Panopoulou & Lenz 2020). The locations of the northern and southern sky patches studied in order to investigate the effect of target and control sampling different sky regions are shown with the green and magenta circles, respectively.
Current usage metrics show cumulative count of Article Views (full-text article views including HTML views, PDF and ePub downloads, according to the available data) and Abstracts Views on Vision4Press platform.
Data correspond to usage on the plateform after 2015. The current usage metrics is available 48-96 hours after online publication and is updated daily on week days.
Initial download of the metrics may take a while.