Open Access
Fig. 9.
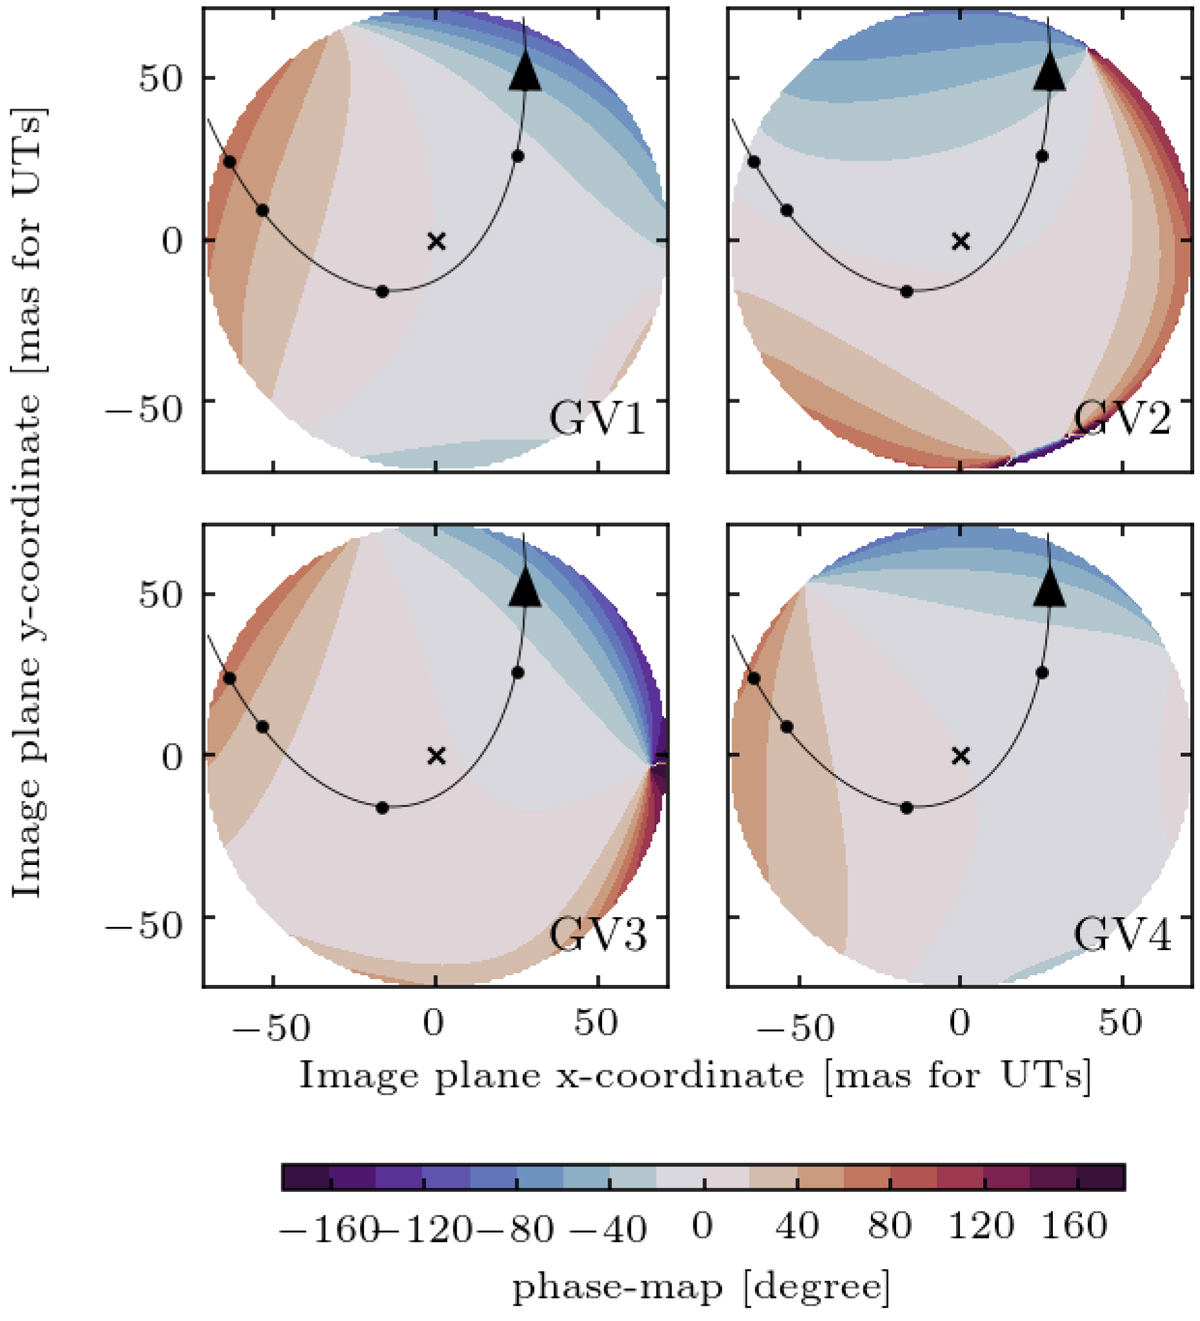
Orbit of S2 relative to the phase maps as applied for the GC analysis (measurement from 3 March 2020, σt = 10 mas). Dots indicate the position of S2 on 2017.2, 2017.6, 2018.2, and 2018.7, respectively, while the cross marks Sgr A*.
Current usage metrics show cumulative count of Article Views (full-text article views including HTML views, PDF and ePub downloads, according to the available data) and Abstracts Views on Vision4Press platform.
Data correspond to usage on the plateform after 2015. The current usage metrics is available 48-96 hours after online publication and is updated daily on week days.
Initial download of the metrics may take a while.