Open Access
Fig. 3.
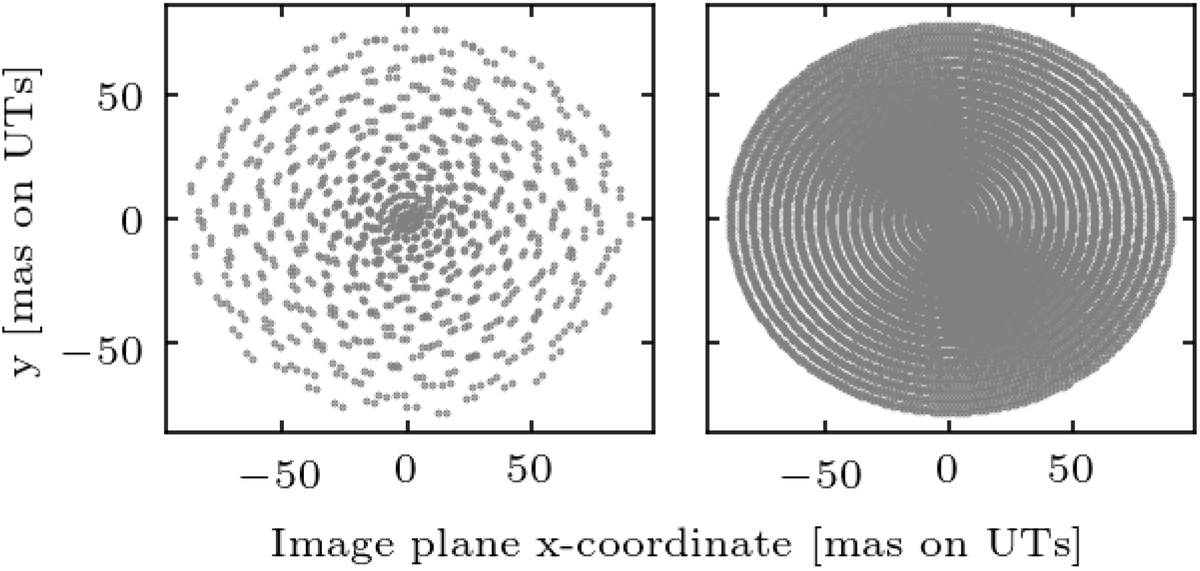
Examples of the scanning pattern applied in the Calibration Unit measurements. SC aberration maps were obtained with a slow modulation frequency (left). For the corresponding FT measurement, a faster scanning was used, and the right panel only shows a single iteration of in- and out-spiral.
Current usage metrics show cumulative count of Article Views (full-text article views including HTML views, PDF and ePub downloads, according to the available data) and Abstracts Views on Vision4Press platform.
Data correspond to usage on the plateform after 2015. The current usage metrics is available 48-96 hours after online publication and is updated daily on week days.
Initial download of the metrics may take a while.