Fig. C.1.
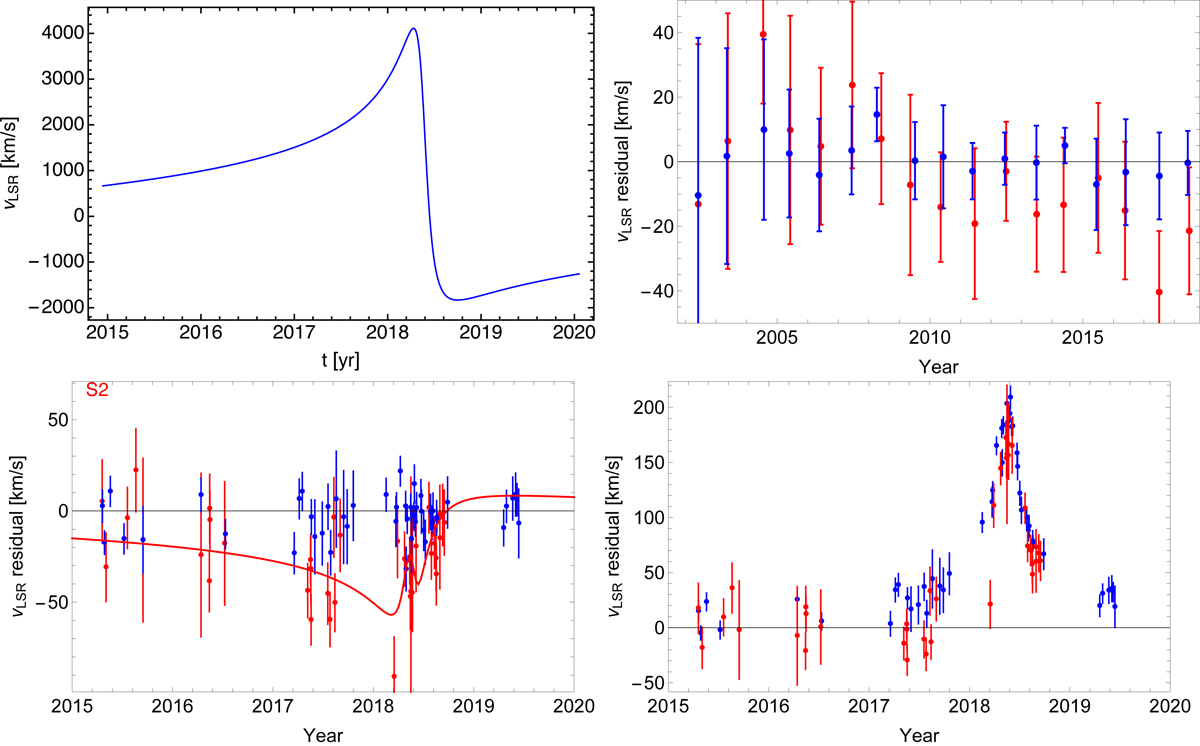
Comparison of the radial velocity data sets. Blue points are data from the VLT data set, and red points are data from the Keck data set. Top left: radial velocity as a function of time for the VLT fit (Eq. (C.1)). Top right: yearly averages of the residua of the two data sets to the fit from Eq. (C.1). By construction, the VLT data thus scatter around 0. The Keck data deviate systematically from 2011 on, and the discrepancy increases in later years. Bottom left: same as the left panel, but zooming in to the period 2015–2020, and showing all individual data points. The best-fit Keck orbit corresponding to Eq. (C.2) is the red line. The difference is apparently largest when the radial velocity is highest (in 2018 at pericenter passage). Bottom right: both data sets show a clear peak in radial velocity in 2018 compared with the Keplerian part of the VLT fit (Eq. (C.1)), i.e., both data sets clearly detect the redshift term.
Current usage metrics show cumulative count of Article Views (full-text article views including HTML views, PDF and ePub downloads, according to the available data) and Abstracts Views on Vision4Press platform.
Data correspond to usage on the plateform after 2015. The current usage metrics is available 48-96 hours after online publication and is updated daily on week days.
Initial download of the metrics may take a while.