Fig. 10.
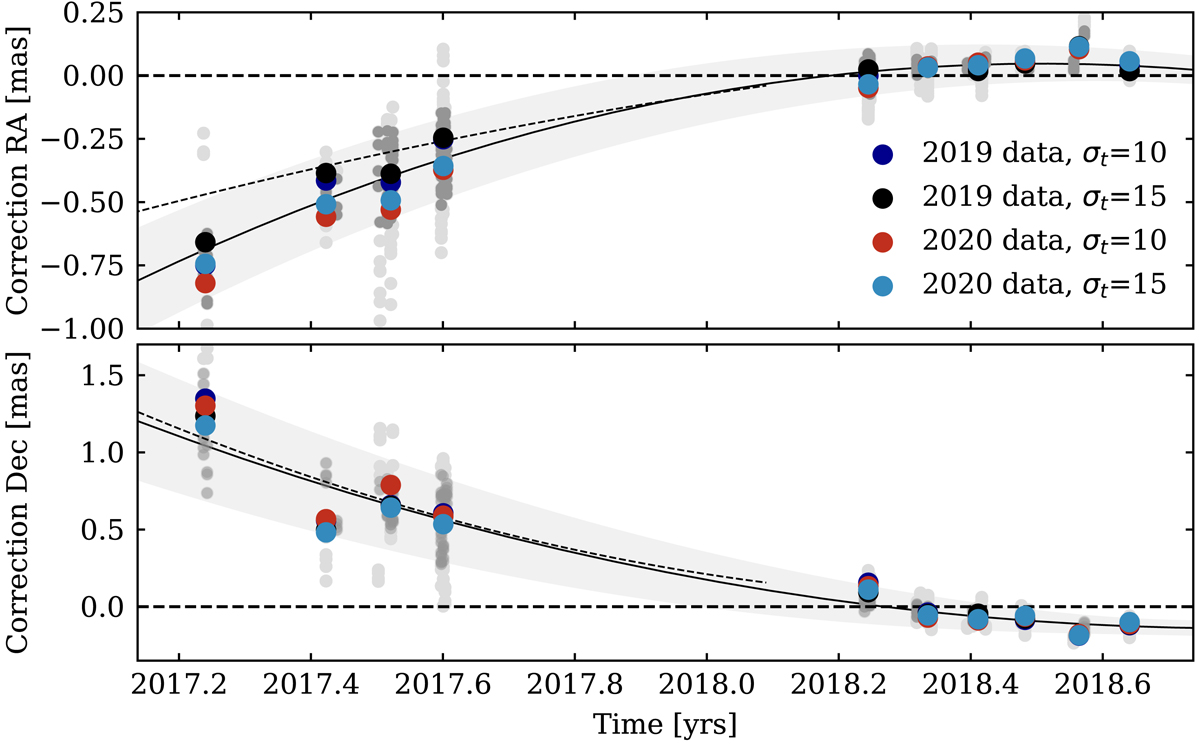
Difference in the position of S2 obtained from an analysis with and without the aberration corrections. Colored dots indicate the epoch-wise mean for different realizations of the phase- and amplitude-maps, and gray dots show the results for individual observations. From these, we determine a mean position correction as a function of time with a corresponding upper and lower limit as indicated by the solid black line and the gray band. The thin dashed line finally represents the correction applied in Gravity Collaboration (2019).
Current usage metrics show cumulative count of Article Views (full-text article views including HTML views, PDF and ePub downloads, according to the available data) and Abstracts Views on Vision4Press platform.
Data correspond to usage on the plateform after 2015. The current usage metrics is available 48-96 hours after online publication and is updated daily on week days.
Initial download of the metrics may take a while.