Fig. 2.
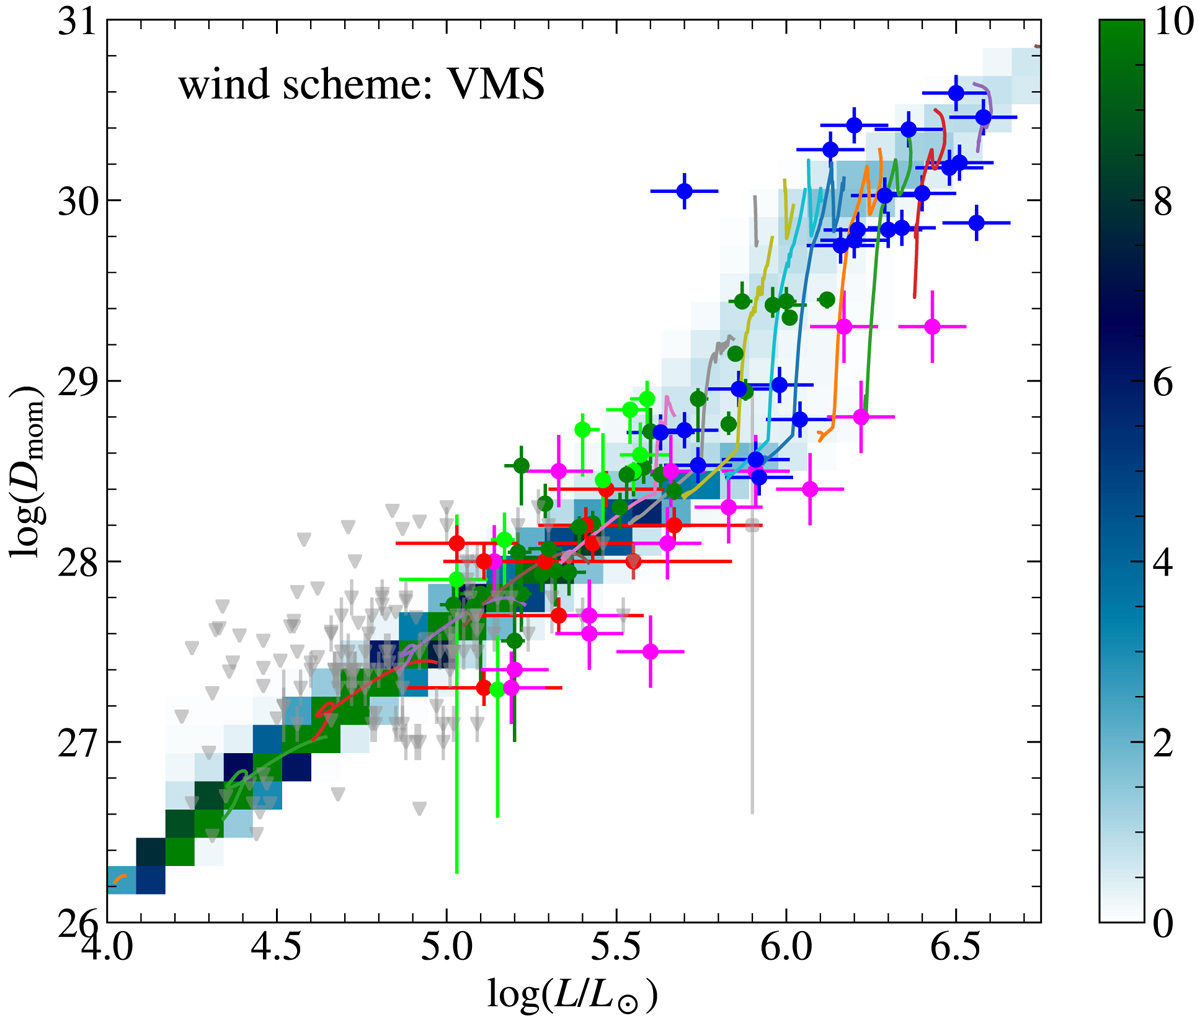
Wind-momentum – luminosity relation for O and WNh stars in 30 Dor. Different symbols indicate empirical results for the most massive stars in 30 Dor from Bestenlehner et al. (2014) in blue, O-type giants and supergiants from Ramírez-Agudelo et al. (2017) Tables C.4 (dark green) and C.5 (light green), and O-type dwarfs from Sabín-Sanjulián et al. (2017) Tables A.1 (red) and A.2 (pink). Upper limits are indicated in grey. Evolutionary tracks are indicated by coloured lines analogous to Fig. 5 but restricted to the O star range. Predicted absolute numbers of stars according to our population synthesis models are mapped and colour coded as indicated by the colour bar on the right.
Current usage metrics show cumulative count of Article Views (full-text article views including HTML views, PDF and ePub downloads, according to the available data) and Abstracts Views on Vision4Press platform.
Data correspond to usage on the plateform after 2015. The current usage metrics is available 48-96 hours after online publication and is updated daily on week days.
Initial download of the metrics may take a while.