Fig. 1.
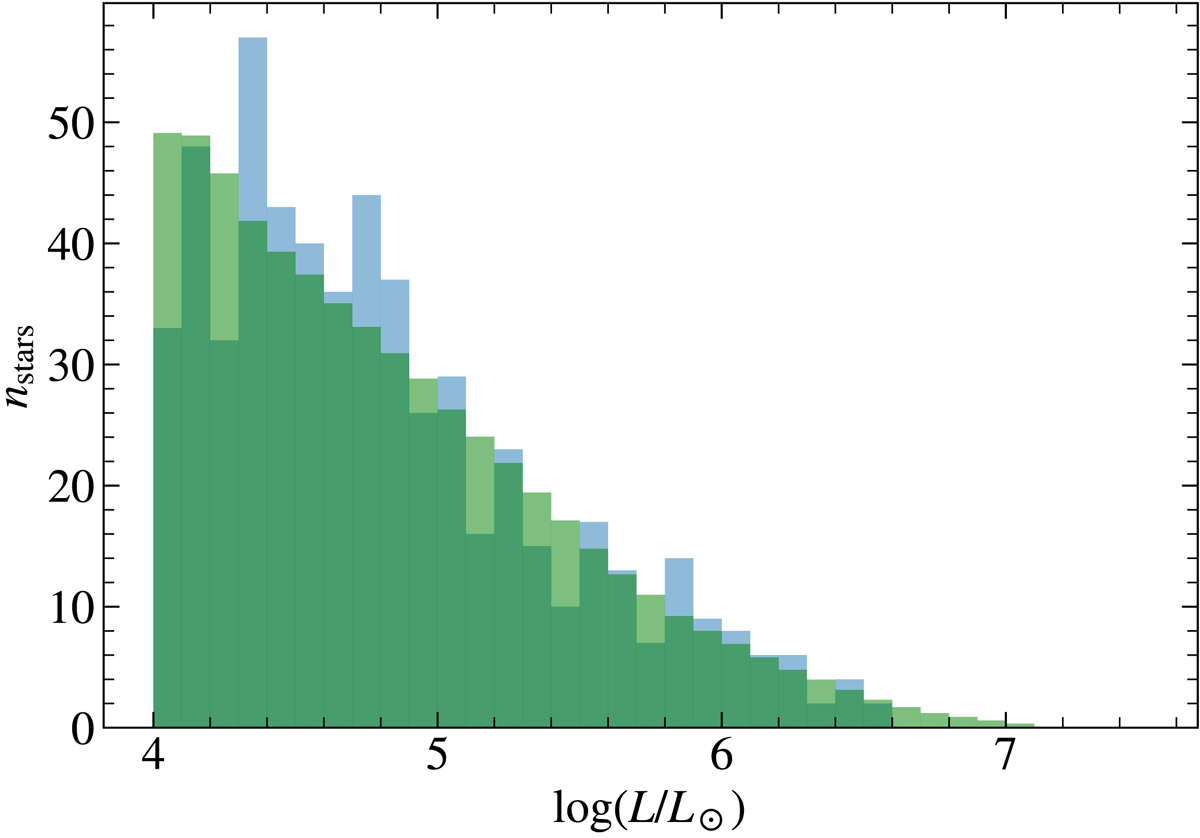
Observed luminosity distribution of single stars in 30 Dor compared to theoretical predictions. The histogram shows the observed numbers of single stars in the VFTS sample as function of luminosity (blue) compared to the theoretical distribution resulting from our VMS population synthesis models described in Sect. 4 (green). Both distributions are plotted transparent so that overlaps appear in dark green.
Current usage metrics show cumulative count of Article Views (full-text article views including HTML views, PDF and ePub downloads, according to the available data) and Abstracts Views on Vision4Press platform.
Data correspond to usage on the plateform after 2015. The current usage metrics is available 48-96 hours after online publication and is updated daily on week days.
Initial download of the metrics may take a while.