Fig. A.1.
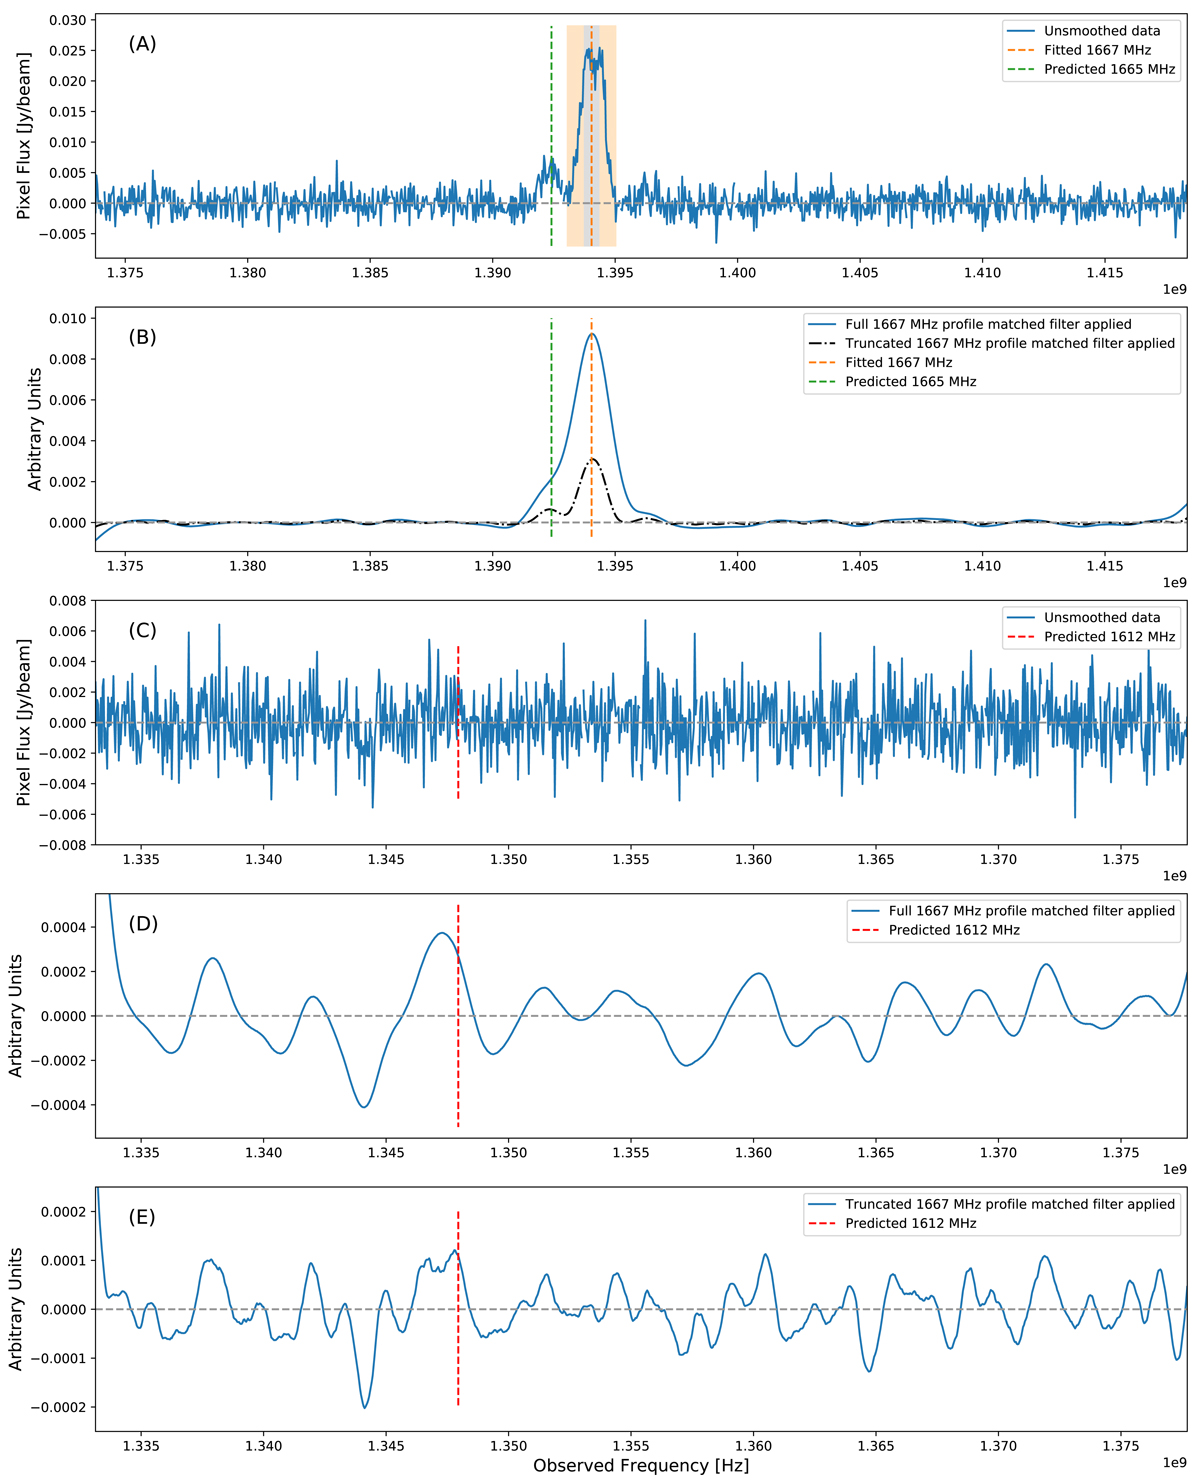
Summary of the matched filter tests. Panel A: the full resolution (unsmoothed) pixel spectrum showing the 1665 and 1667 MHz lines. The orange shaded region shows the extent of the OH 1667 MHz profile for the full matched filter. The gray shaded region shows the extent of the OH 1667 MHz profile that has been used for the truncated filter. It matches the width over which the 1612 MHz line was measured in Sect. 3. Panel B: the matched filters applied to the unsmoothed data. Panel C: the full resolution pixel spectrum covering the predicted frequency of the 1612 MHz line. Panel D: the full 1667 profile matched filter applied to the unsmoothed 1612 MHz data. Panel E: the truncated 1667 MHz profile matched filter applied to the unsmoothed 1612 MHz data.
Current usage metrics show cumulative count of Article Views (full-text article views including HTML views, PDF and ePub downloads, according to the available data) and Abstracts Views on Vision4Press platform.
Data correspond to usage on the plateform after 2015. The current usage metrics is available 48-96 hours after online publication and is updated daily on week days.
Initial download of the metrics may take a while.