Fig. 3.
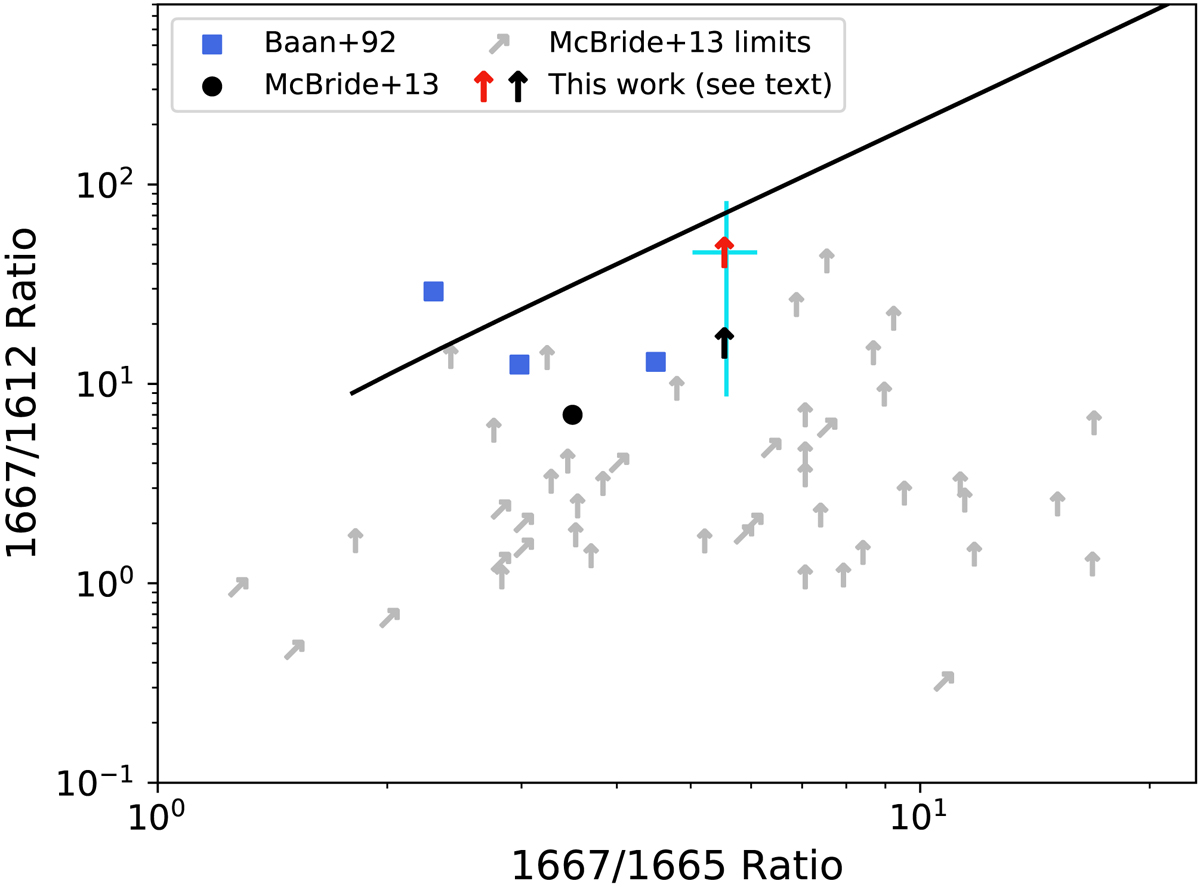
OH color-color plot for the 1612 MHz line, adapted from McBride et al. (2013). Blue squares come from the literature, collated by Baan et al. (1992a) in their Table 2(a); the black circle and the gray arrows are the detection and upper limits from McBride et al. (2013), respectively. The red arrow is the RH ratio and R1612 upper limit from this work; the cyan cross shows our uncertainties; the black arrow is the upper limit calculated using the McBride et al. (2013) methodology (see Sect. 4.2). The black line shows the predicted ratios assuming equal excitation temperatures for all OH lines, with varying 1667 MHz optical depth (Lockett & Elitzur 2008; McBride et al. 2013).
Current usage metrics show cumulative count of Article Views (full-text article views including HTML views, PDF and ePub downloads, according to the available data) and Abstracts Views on Vision4Press platform.
Data correspond to usage on the plateform after 2015. The current usage metrics is available 48-96 hours after online publication and is updated daily on week days.
Initial download of the metrics may take a while.