Fig. 1.
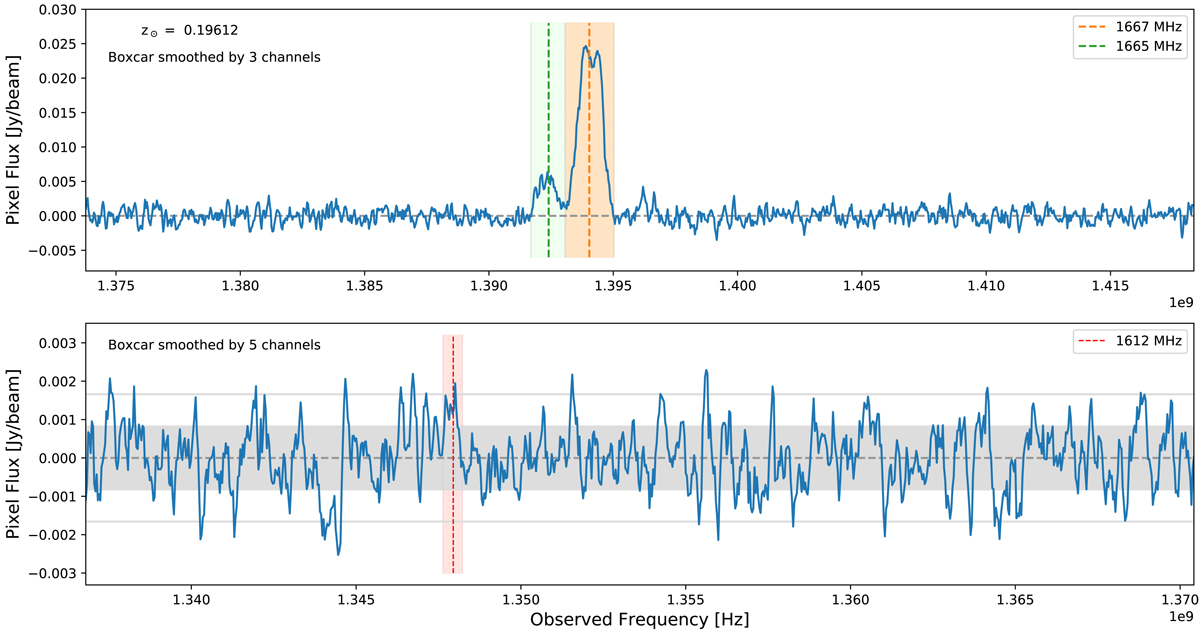
Pixel spectra extracted at the position of the peak of the 1667 MHz total intensity map. Top: spectrum of the 1665 and 1667 MHz main lines. Bottom: spectrum of the 1612 MHz satellite line. The 1667 MHz line center is provided by a fit to the line profile by SoFiA. The 1665 and 1612 MHz lines are plotted at the expected frequency based on the 1667 MHz line redshift. The orange, green, and red shaded regions indicate the channel range used to calculate the integrated flux of each line, which correspond to widths of 433, 308, and 138 km s−1, respectively. The gray shaded region in the bottom plot shows the ±1 sigma noise range of the smoothed data; the gray line indicates ±2 sigma.
Current usage metrics show cumulative count of Article Views (full-text article views including HTML views, PDF and ePub downloads, according to the available data) and Abstracts Views on Vision4Press platform.
Data correspond to usage on the plateform after 2015. The current usage metrics is available 48-96 hours after online publication and is updated daily on week days.
Initial download of the metrics may take a while.