Fig. 2.
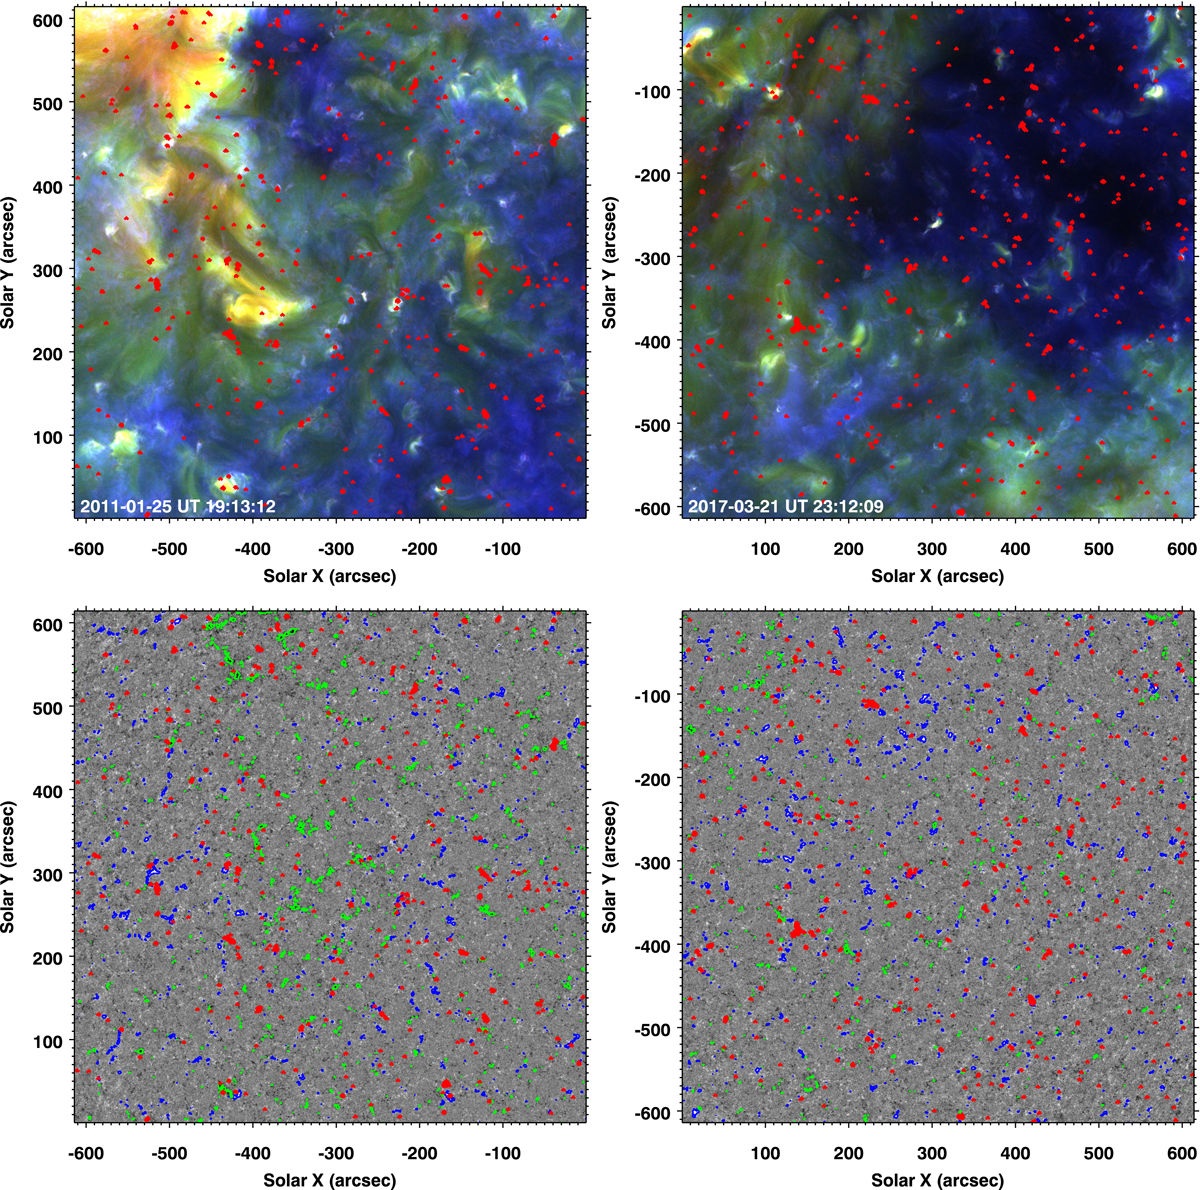
Overview of the quiet-Sun coronal regions we analyzed and the underlying surface magnetic fields. A closer view of the coronal regions, outlined by white boxes in Fig. 1, is presented in the top panels. The field of view is 614″ × 614″. The red contours outline spatial locations of EUV bursts in the respective panels at that instance. The bottom panels show the line-of-sight magnetic field maps observed with SDO/HMI in grayscale. They are cotemporal with respect to the top panels, which are overlaid with red contours. The maps are saturated at ±50 G. The dark shaded regions represent south or negative-polarity magnetic field patches, and the light shaded regions represent north or positive-polarity magnetic field patches. The blue and green contours cover positive- and negative-polarity magnetic patches, respectively, with flux densities above 50 G. See Sects. 2, 3.1, and 3.2 for details.
Current usage metrics show cumulative count of Article Views (full-text article views including HTML views, PDF and ePub downloads, according to the available data) and Abstracts Views on Vision4Press platform.
Data correspond to usage on the plateform after 2015. The current usage metrics is available 48-96 hours after online publication and is updated daily on week days.
Initial download of the metrics may take a while.