Fig. 7
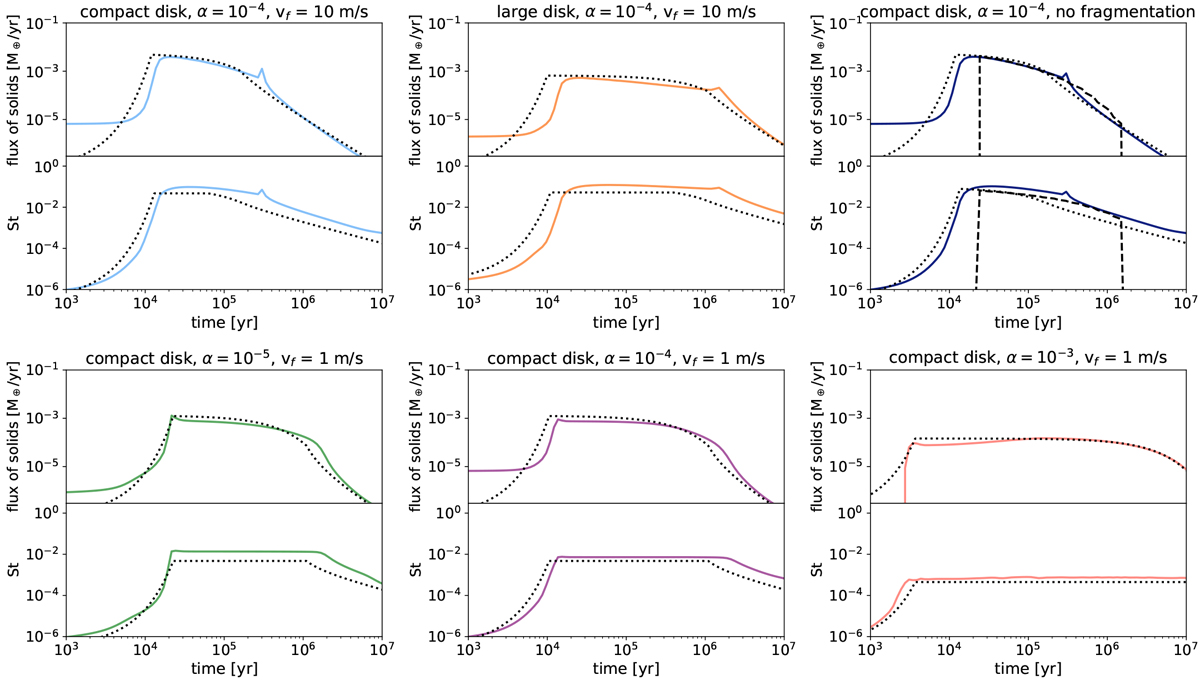
Comparison of pebble flux and Stokes number predictions and simulation results for different models, as indicated by the title of each subplot at 10 au. The solid lines show the DustPy results, the dotted lines come from the pebble predictor. The dashed line in the top right panel corresponds to the model proposed by Lambrechts & Johansen (2014), which can only be used if the fragmentation is not included.
Current usage metrics show cumulative count of Article Views (full-text article views including HTML views, PDF and ePub downloads, according to the available data) and Abstracts Views on Vision4Press platform.
Data correspond to usage on the plateform after 2015. The current usage metrics is available 48-96 hours after online publication and is updated daily on week days.
Initial download of the metrics may take a while.