Fig. 4.
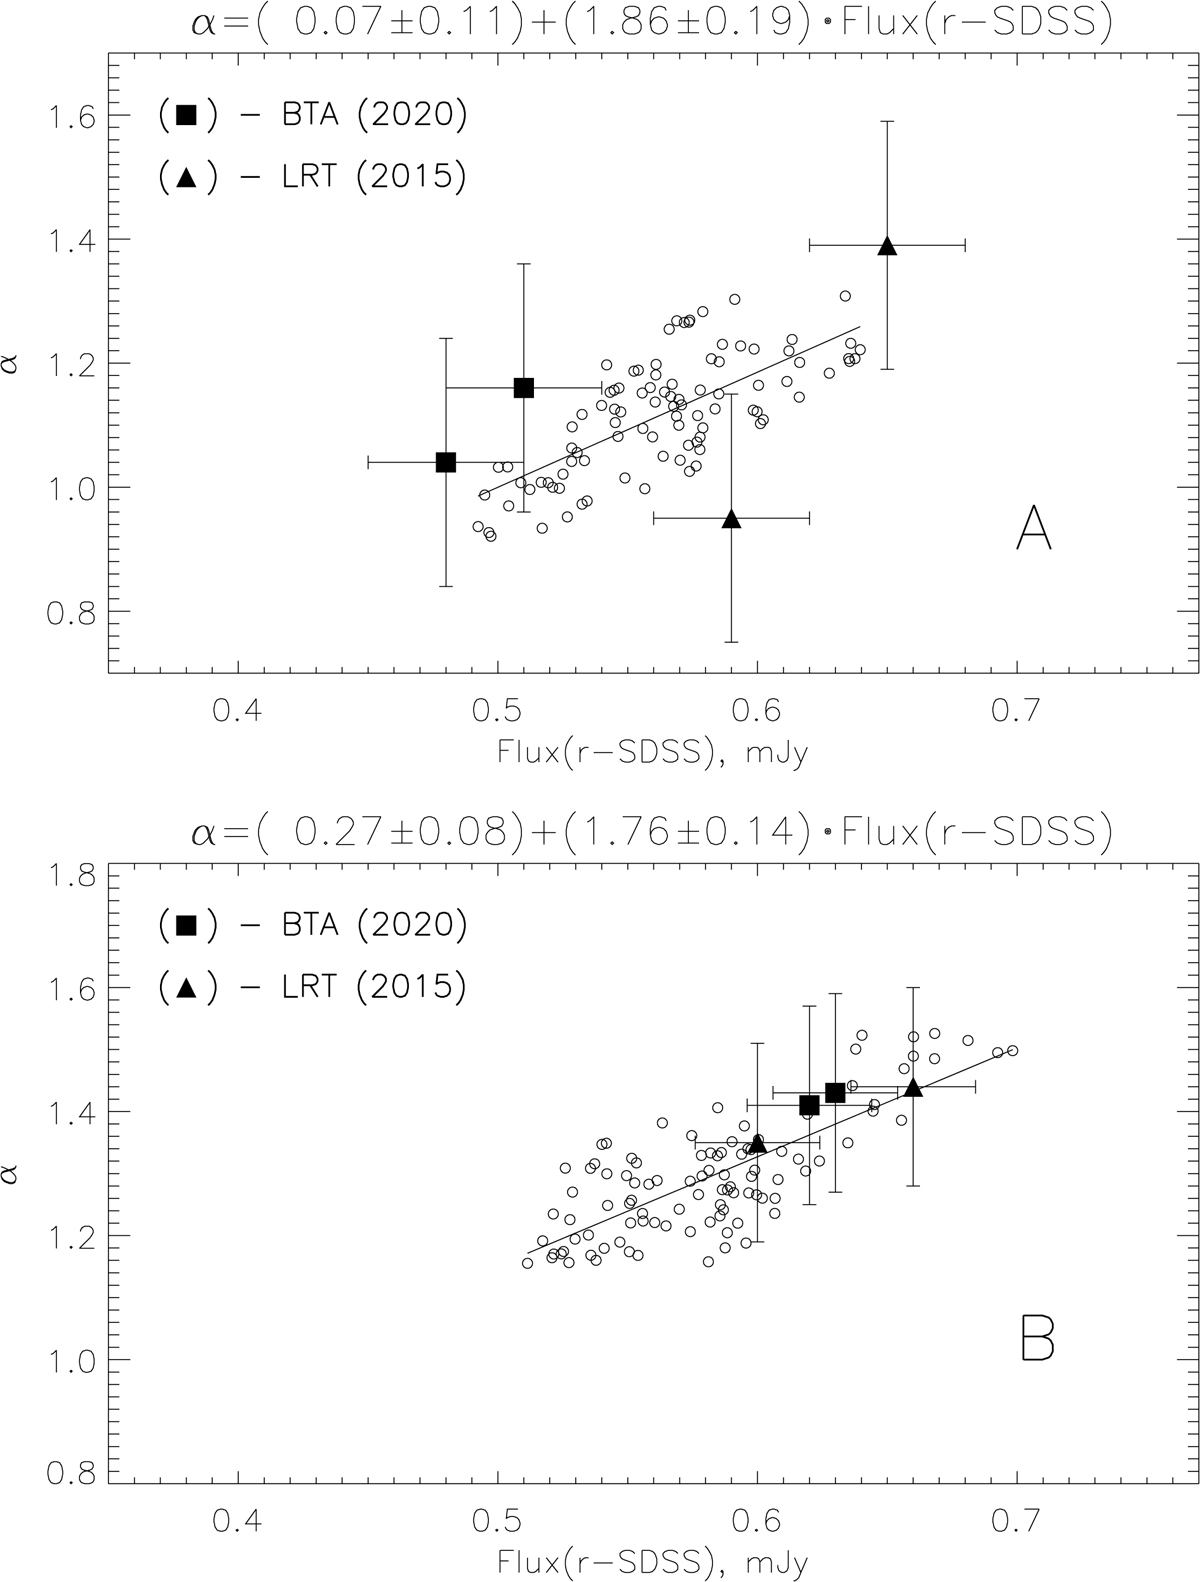
Changes in the slope α as a function of the observed flux for components A (upper panel) and B (lower panel). Open circles denote the photometric data taken from Shalyapin et al. (2012). Solid squares denote our observations (BTA) and solid triangles the observations with LRT given in the database of bright quasars (see Gil-Merino et al. 2018). The BTA and LRT observations were conducted in the spectral mode, which explains the significant errorbars.
Current usage metrics show cumulative count of Article Views (full-text article views including HTML views, PDF and ePub downloads, according to the available data) and Abstracts Views on Vision4Press platform.
Data correspond to usage on the plateform after 2015. The current usage metrics is available 48-96 hours after online publication and is updated daily on week days.
Initial download of the metrics may take a while.