Fig. 3.
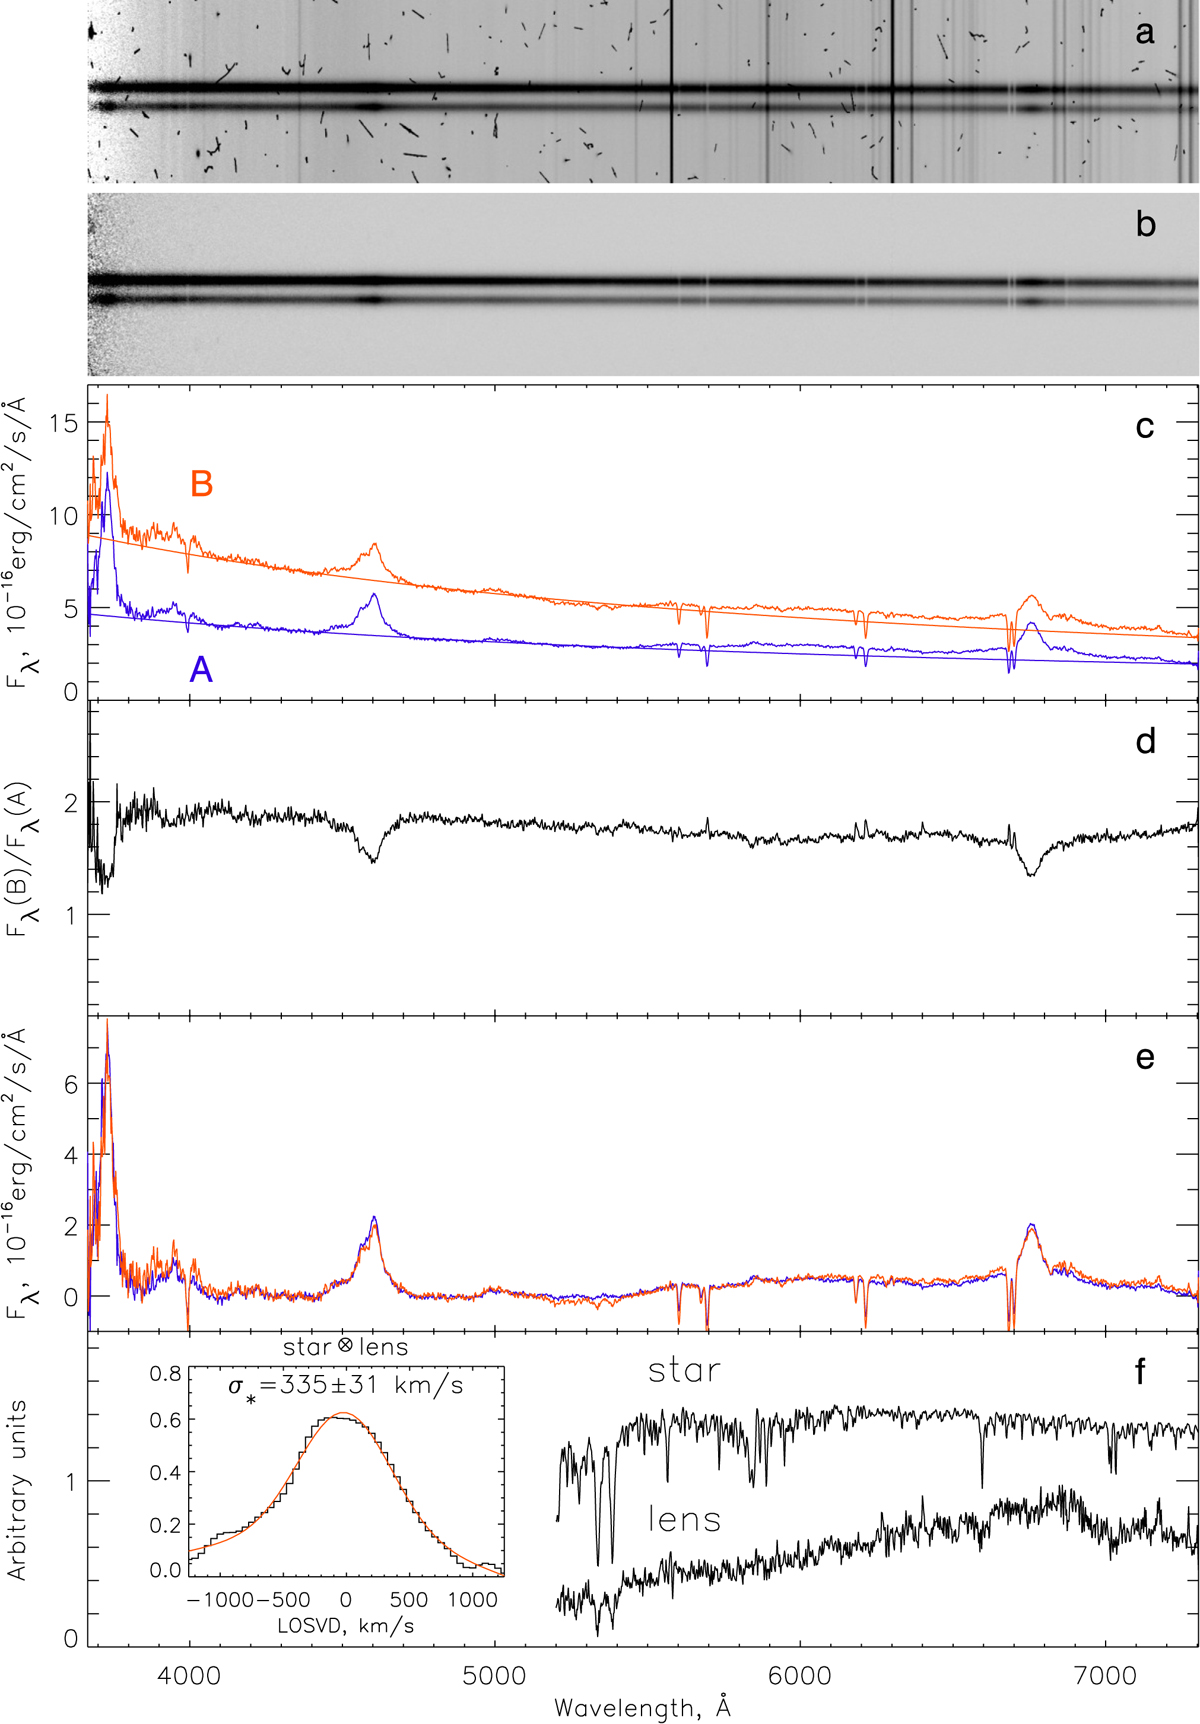
Long-slit spectra of the A and B components of Q0957+561. Panel a: linearized source spectrum. Panel b: sky subtracted spectrum with removed cosmic rays. Panel c: extracted spectra of components A (blue) and B (red) of the lensed quasar image. Panel d: brightness ratio of the components. Panel e: spectra of components A (blue) and B (red) after continuum subtraction. Panel f: spectrum of the lensing galaxy in arbitrary units and the comparison star, shifted by z = 0.36. Panel f (left): also shows the cross-correlation function between the spectra of the star and the lens galaxy.
Current usage metrics show cumulative count of Article Views (full-text article views including HTML views, PDF and ePub downloads, according to the available data) and Abstracts Views on Vision4Press platform.
Data correspond to usage on the plateform after 2015. The current usage metrics is available 48-96 hours after online publication and is updated daily on week days.
Initial download of the metrics may take a while.