Fig. 5
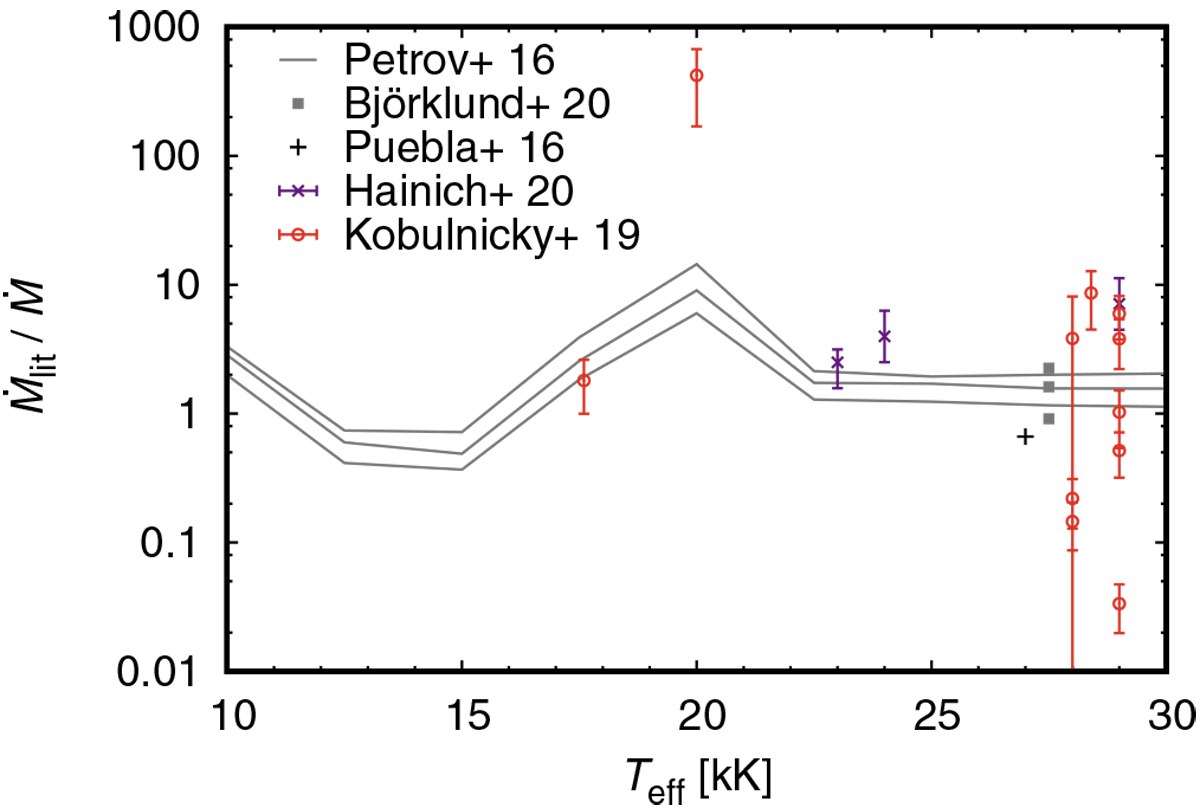
Ratio of observational (Ṁlit) and predicted (Ṁ) mass-loss rates as a function of effective temperature Teff for B supergiants. Only observational mass-loss rates that are either independent of clumping or were corrected for clumping in some way are plotted. The observational results are based on X-ray line profiles (Puebla et al. 2016), UV spectrum analysis with clumping (Hainich et al. 2020), and wind bow shocks (Kobulnicky et al. 2019). The gray lines denote predictions of Petrov et al. (2016) for different luminosities and masses and the gray squares correspond to predictions of Björklund et al. (2020) and Teff = 27 500 K.
Current usage metrics show cumulative count of Article Views (full-text article views including HTML views, PDF and ePub downloads, according to the available data) and Abstracts Views on Vision4Press platform.
Data correspond to usage on the plateform after 2015. The current usage metrics is available 48-96 hours after online publication and is updated daily on week days.
Initial download of the metrics may take a while.