Fig. 4
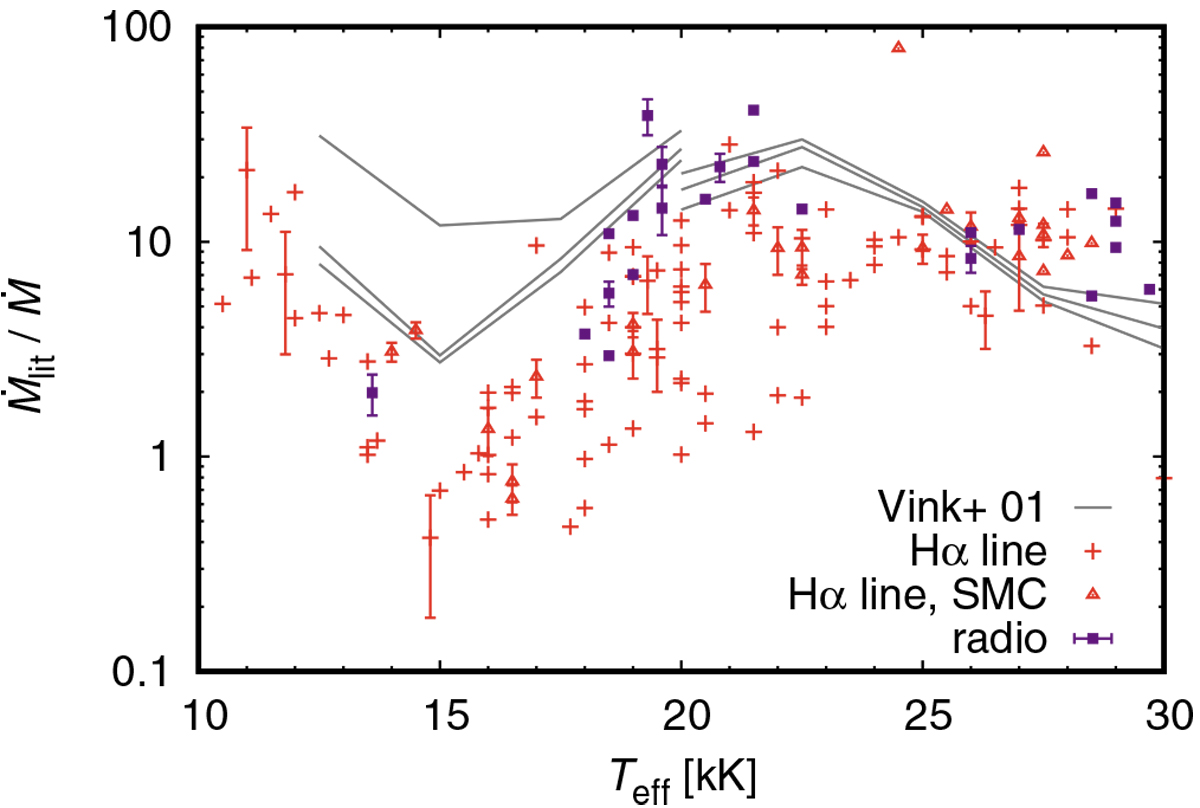
Ratio of published mass-loss rates derived from observations using analysis that neglects clumping (Ṁlit), and mass-loss rates predicted using Eq. (3), plotted as a function of effective temperature Teff for B supergiants. The observations include Balmer line (mostly Hα) mass-loss rates of Galactic B supergiants (Kudritzki et al. 1999; Crowther et al. 2006; Lefever et al. 2007; Markova & Puls 2008; Haucke et al. 2018, red plus symbols), Hα mass-loss rates of B supergiants from the Small Magellanic Cloud (Evans et al. 2004; Trundle et al. 2004; Trundle & Lennon 2005, red triangles) scaled according to Ṁ ~ Z0.59 (Krtička& Kubát 2018), and mass-loss rates from radio data (Scuderi et al. 1998; Benaglia et al. 2007, violet squares). The ratios of the predictions of Vink et al. (2001) to our predictions for three different luminosities are overplotted (solid gray lines). Plotted with v∕vesc = 2 for Teff ≥ 20 kK and with v∕vesc = 1.3 for Teff ≤ 20 kK.
Current usage metrics show cumulative count of Article Views (full-text article views including HTML views, PDF and ePub downloads, according to the available data) and Abstracts Views on Vision4Press platform.
Data correspond to usage on the plateform after 2015. The current usage metrics is available 48-96 hours after online publication and is updated daily on week days.
Initial download of the metrics may take a while.