Fig. 9.
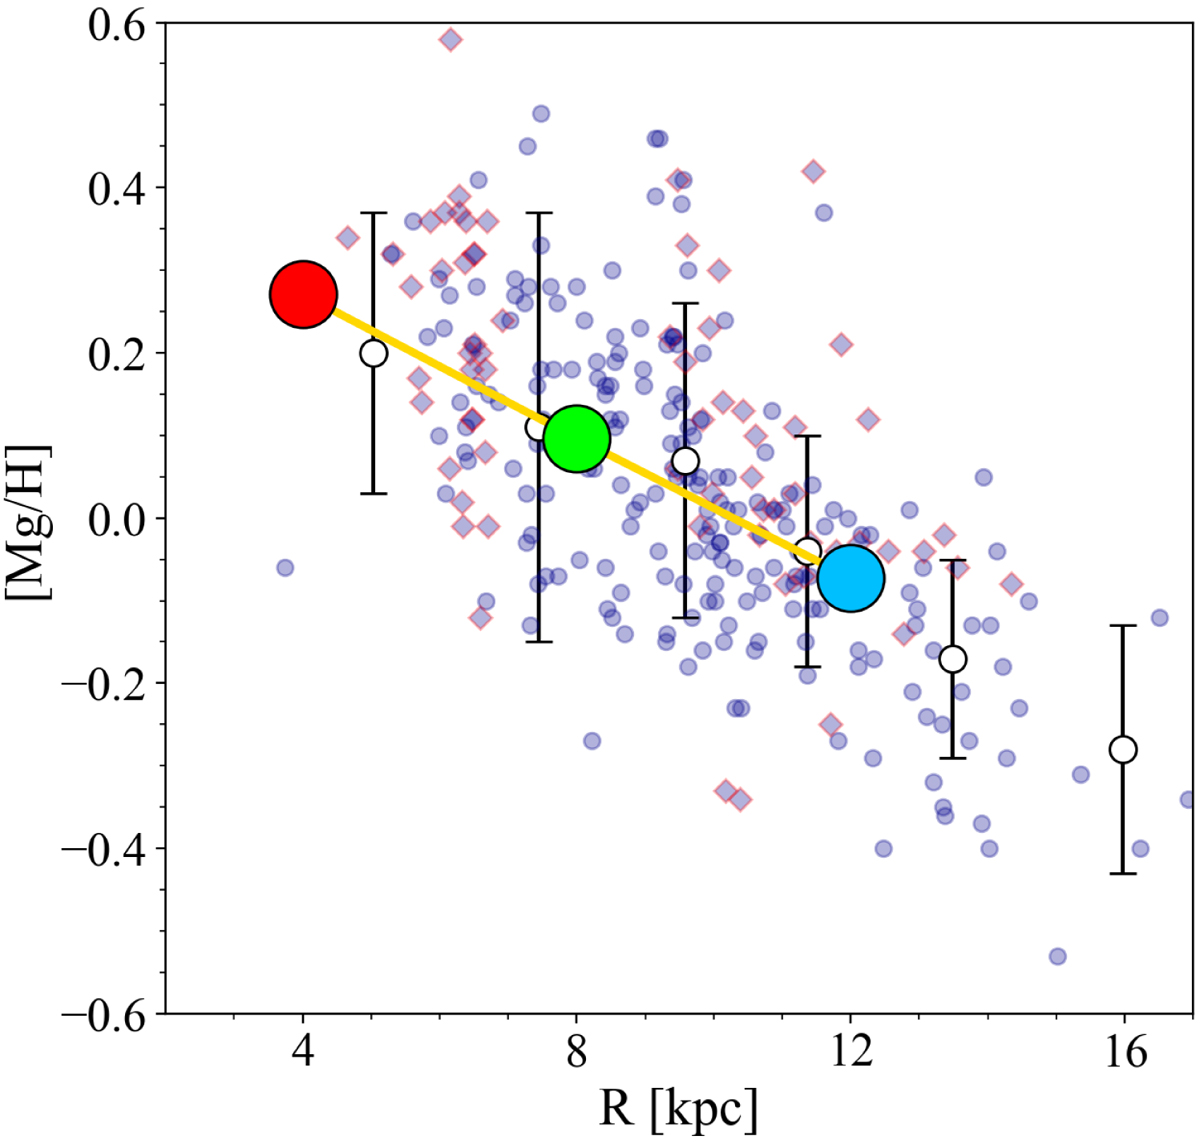
Observed and predicted radial [Mg/H] present-day abundance gradient. The prediction of the best-fit models are indicated with big filled circles, connected with a yellow line. The observational data are the Cepheid observations from Luck & Lambert (2011; blue circles) and Genovali et al. (2015; blue diamonds with red edges). With the empty circles we report the average values and associated errors of the full data sample.
Current usage metrics show cumulative count of Article Views (full-text article views including HTML views, PDF and ePub downloads, according to the available data) and Abstracts Views on Vision4Press platform.
Data correspond to usage on the plateform after 2015. The current usage metrics is available 48-96 hours after online publication and is updated daily on week days.
Initial download of the metrics may take a while.