Fig. 3.
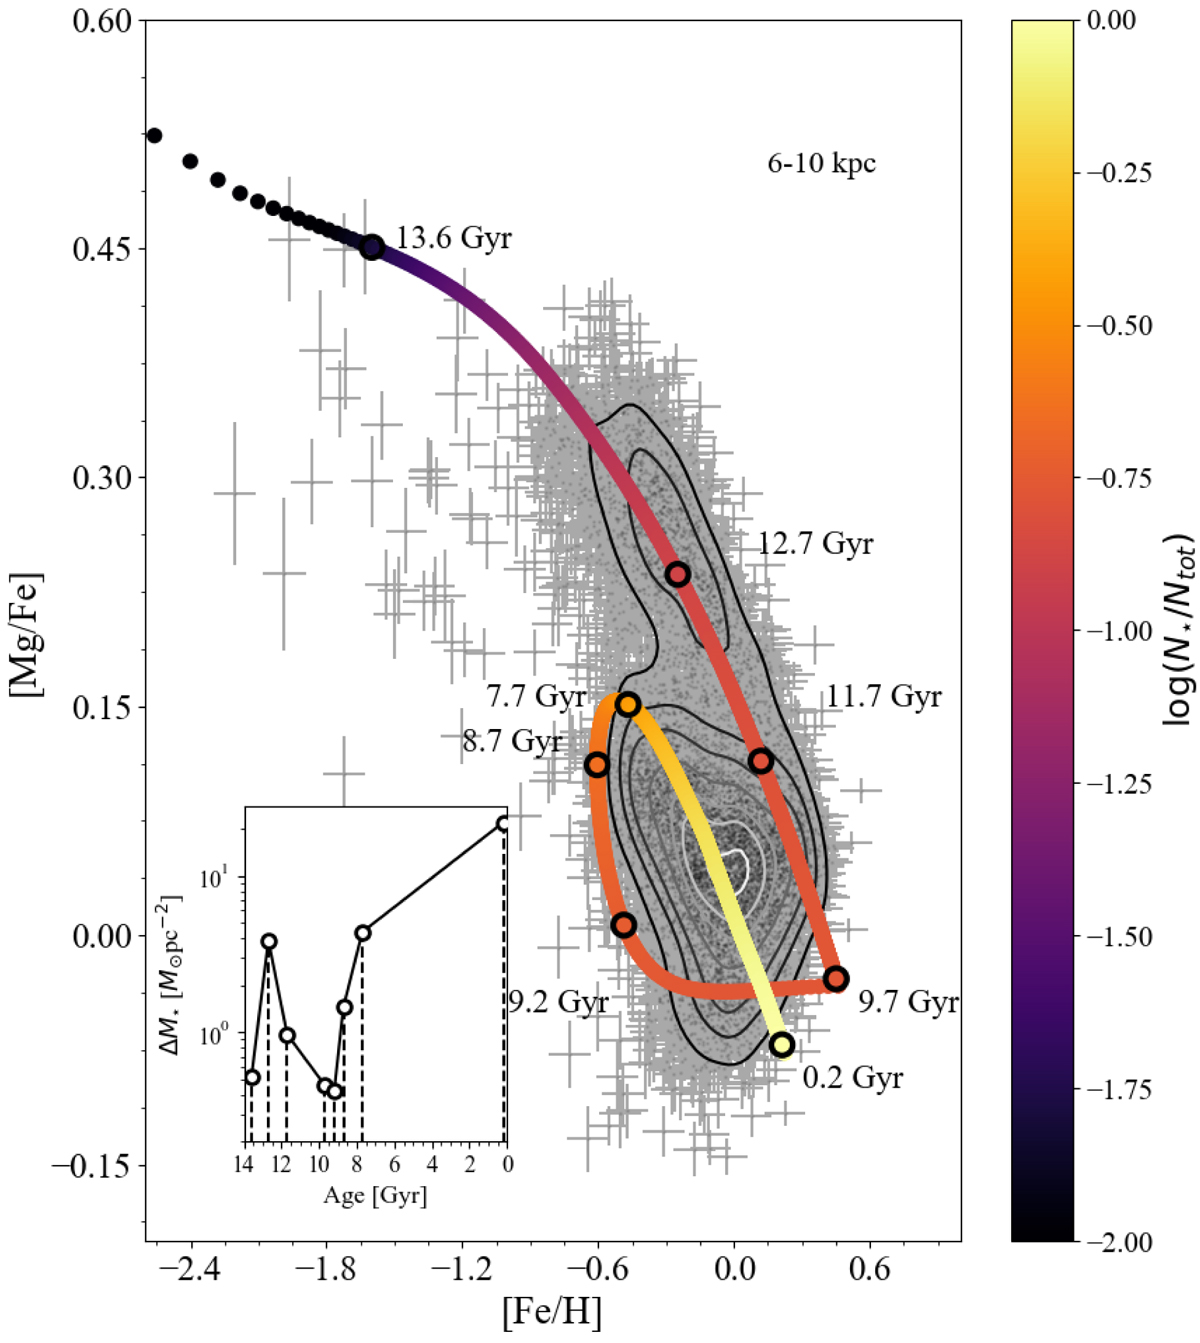
Observed [Mg/Fe] versus [Fe/H] abundance ratios from APOGEE DR16 (Ahumada et al. 2020; grey points with associated errors) in the Galactocentric region between 6 and 10 kpc compared with the best-fit chemical evolution model (thick curve) in that region. As in Fig. 1, the contour lines enclose fractions of 0.90, 0.75, 0.60, 0.45, 0.30, 0.20, 0.05 of the total number of observed stars. The colour coding represents the cumulative number of stars formed during the Galactic evolution normalised to the total number Ntot. The open circles mark the model abundance ratios of stellar populations with different ages. In the inset we show the surface stellar mass density ΔM⋆ formed in different age bins as a function of age, where the bin sizes are delimited by the vertical dashed lines and correspond to the same age values as indicated in the [Mg/Fe] vs [Fe/H] plot.
Current usage metrics show cumulative count of Article Views (full-text article views including HTML views, PDF and ePub downloads, according to the available data) and Abstracts Views on Vision4Press platform.
Data correspond to usage on the plateform after 2015. The current usage metrics is available 48-96 hours after online publication and is updated daily on week days.
Initial download of the metrics may take a while.