Fig. 2.
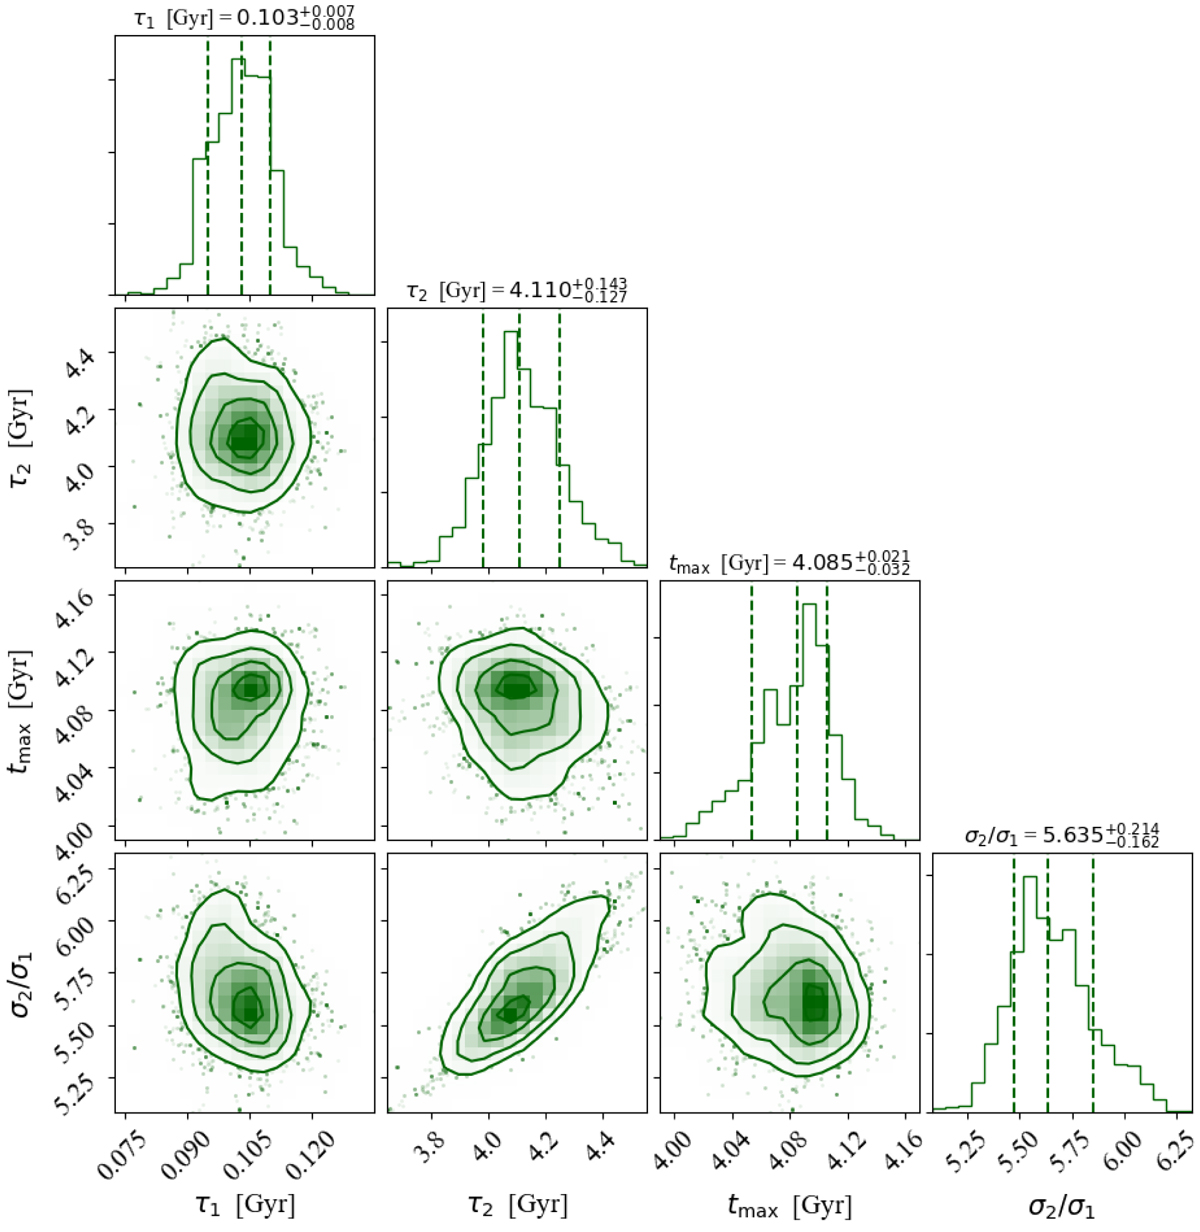
Corner plot showing the posterior PDFs of the chemical evolution model parameters for the region at 8 kpc. For each parameter, the median and the 16th and 84th percentiles of the posterior PDF are shown with dashed lines above the marginalised PDF. The SFEs are fixed at values of 2 and 1 Gyr−1 for the high- and low-α phases, respectively.
Current usage metrics show cumulative count of Article Views (full-text article views including HTML views, PDF and ePub downloads, according to the available data) and Abstracts Views on Vision4Press platform.
Data correspond to usage on the plateform after 2015. The current usage metrics is available 48-96 hours after online publication and is updated daily on week days.
Initial download of the metrics may take a while.