Fig. 15.
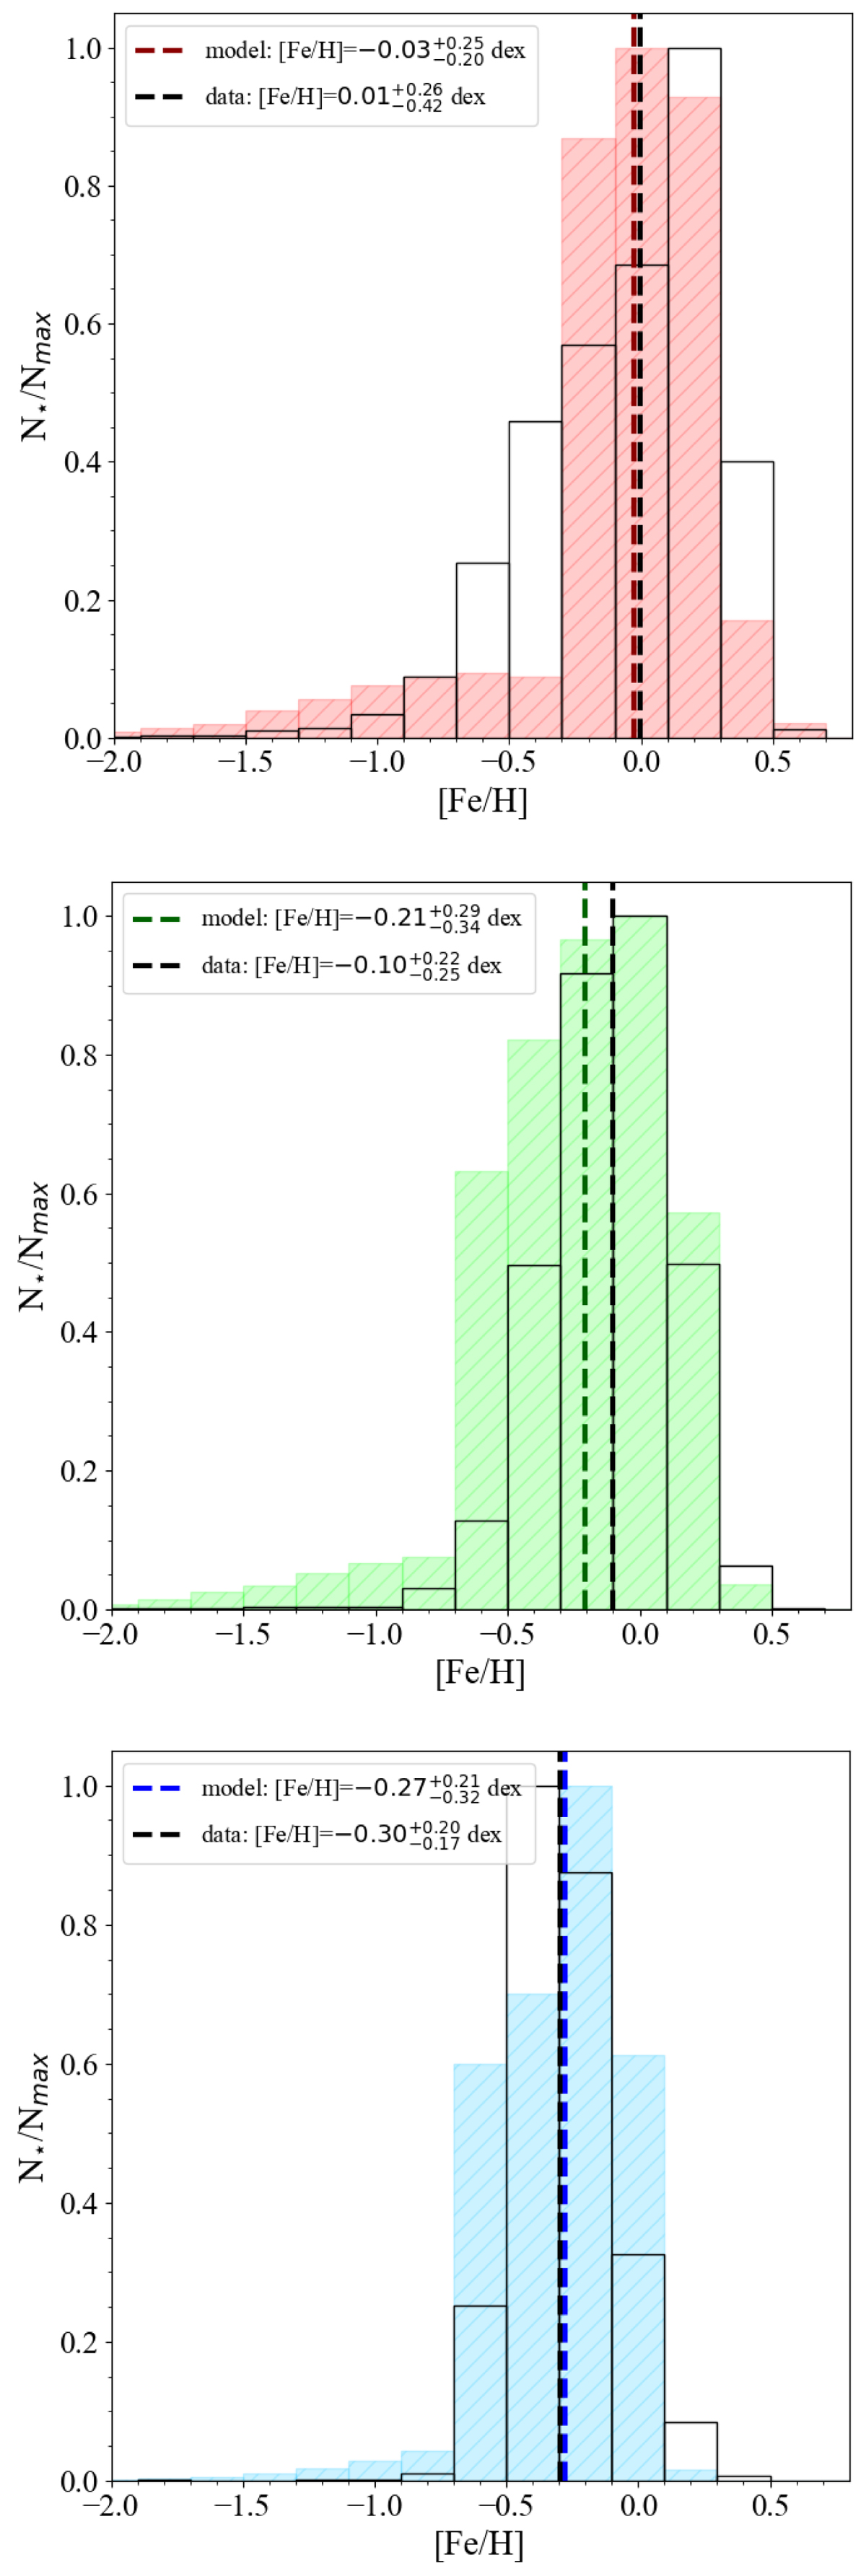
Metallicity distributions predicted by the best-fit models (coloured histograms) computed at 4 kpc (upper panel), 8 kpc (middle panel), and 12 kpc (lower panel). The observed APOGEE DR16 distributions are shown by the black empty histograms. The vertical lines indicate the median values of each distribution. In each plot, the distributions are normalised to the corresponding maximum number of stars, Nmax.
Current usage metrics show cumulative count of Article Views (full-text article views including HTML views, PDF and ePub downloads, according to the available data) and Abstracts Views on Vision4Press platform.
Data correspond to usage on the plateform after 2015. The current usage metrics is available 48-96 hours after online publication and is updated daily on week days.
Initial download of the metrics may take a while.