Fig. 14.
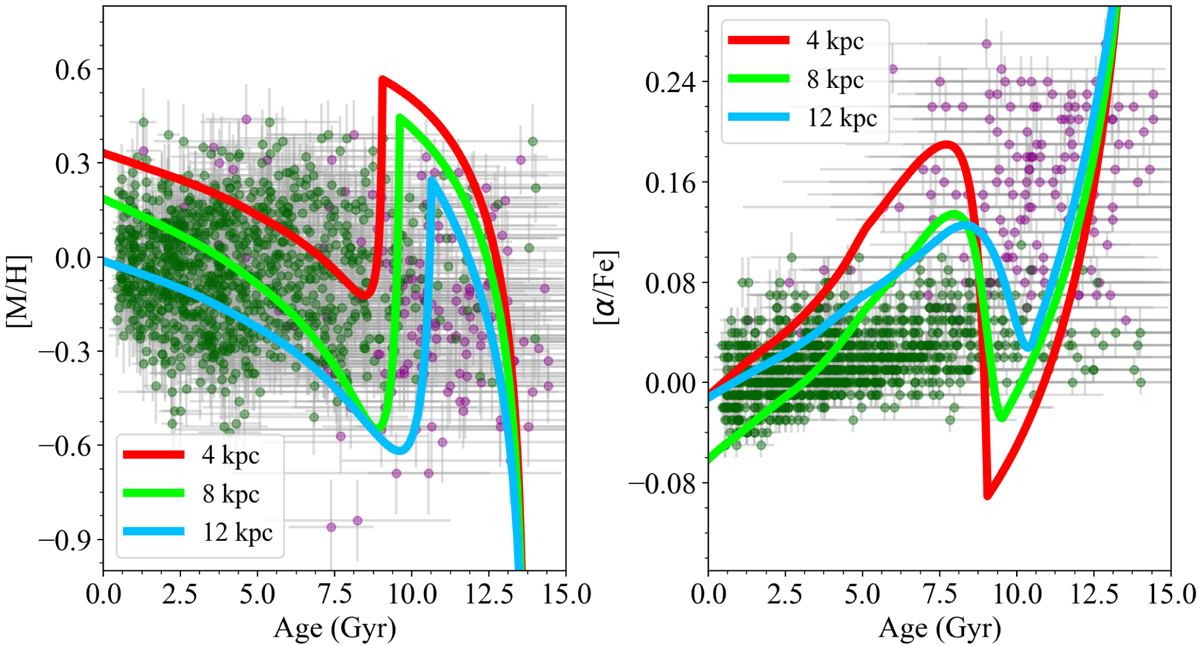
Evolution of the [M/H] (left panel) and [α/Fe] (right panel) abundance ratios of our best-fit models computed at 4, 8, and 12 kpc compared with the abundances observed in a stellar sample in the solar annulus (Silva Aguirre et al. 2018). Magenta points depict the high-α population, whereas green points indicate the low-α one. As in Spitoni et al. (2019a, 2020), we have not taken into account young α-rich stars.
Current usage metrics show cumulative count of Article Views (full-text article views including HTML views, PDF and ePub downloads, according to the available data) and Abstracts Views on Vision4Press platform.
Data correspond to usage on the plateform after 2015. The current usage metrics is available 48-96 hours after online publication and is updated daily on week days.
Initial download of the metrics may take a while.