Fig. 13.
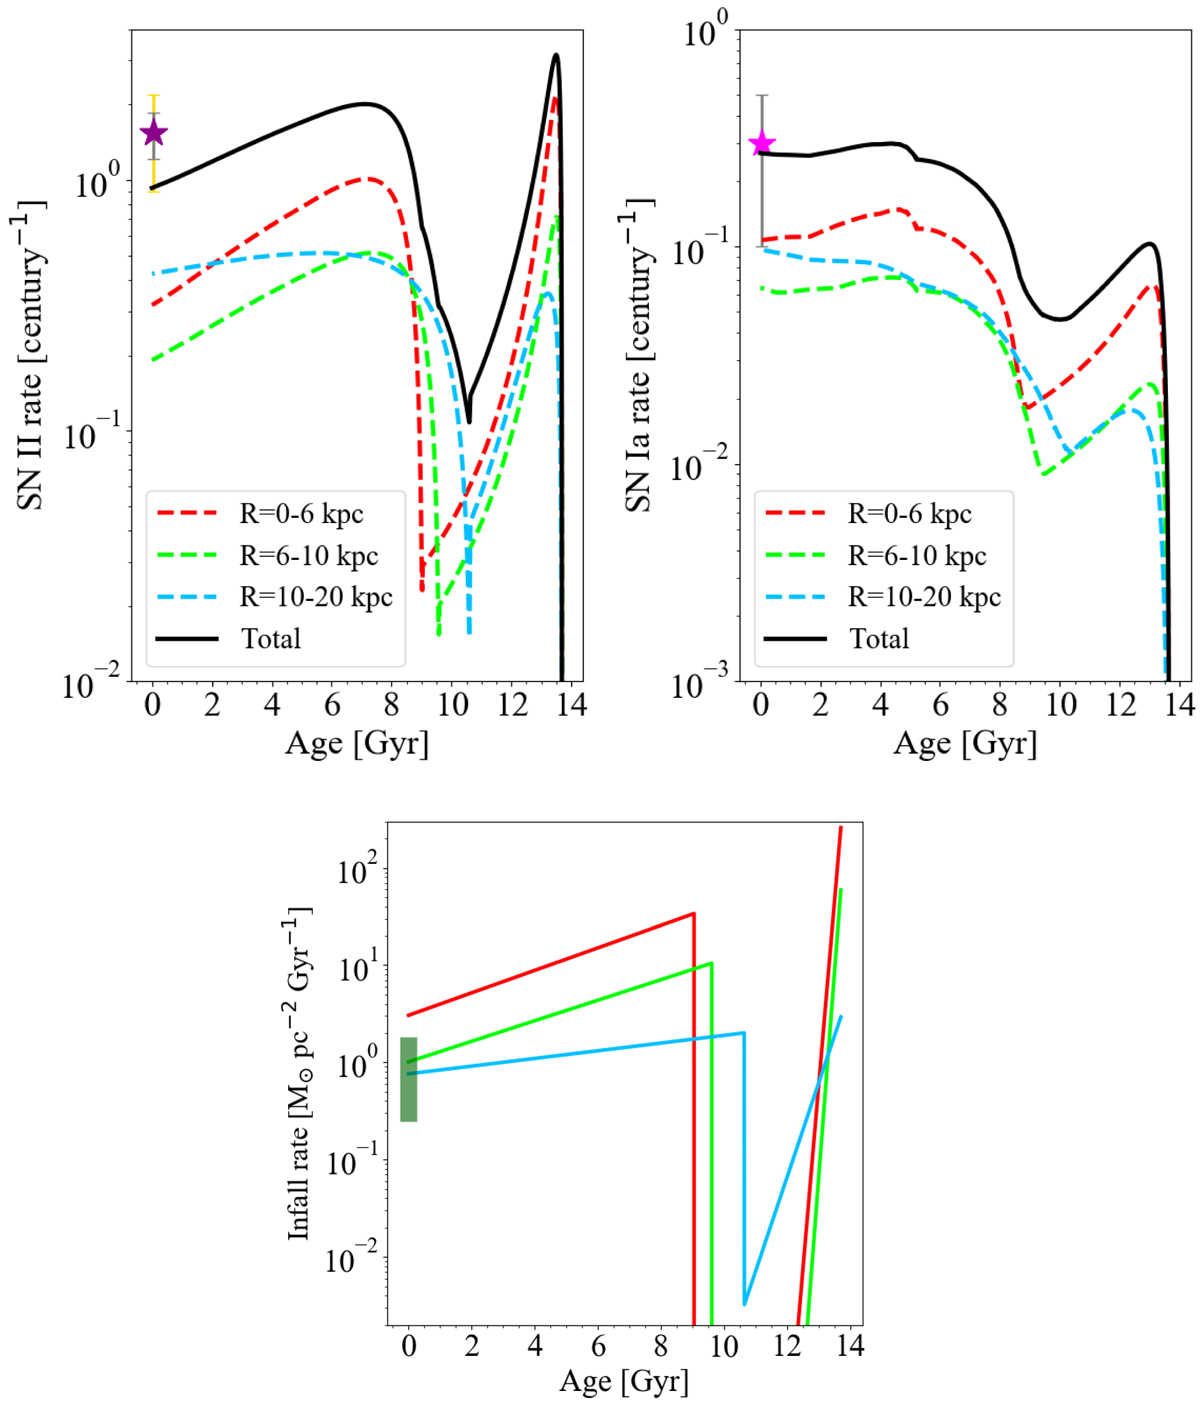
Upper panels: observed and predicted Type II SN rates (left) and Type Ia SN rates (right) as a function of the Galactic age. The SN rates predicted for the whole disc are reported with the black solid lines, and they represent the sum of the contributions from different Galactic regions indicated with coloured dashed lines. The observed present-day Type II SN rate of Li et al. (2011, left panel) for the whole Galaxy is reported with the solid star (1σ and 2σ errors are indicated with grey and yellow bars, respectively) whereas the solid star in the right panel stands for Type Ia SN rate of Cappellaro & Turatto (1997) with the associated 1σ error bar. Lower panel: infall rate evolution predicted by our best fit models computed at 4 (red line), 8 (green line), and 12 kpc (light-blue line). The dark green shaded area indicates the present-day values in the solar annulus suggested by Matteucci (2012).
Current usage metrics show cumulative count of Article Views (full-text article views including HTML views, PDF and ePub downloads, according to the available data) and Abstracts Views on Vision4Press platform.
Data correspond to usage on the plateform after 2015. The current usage metrics is available 48-96 hours after online publication and is updated daily on week days.
Initial download of the metrics may take a while.