Fig. 12.
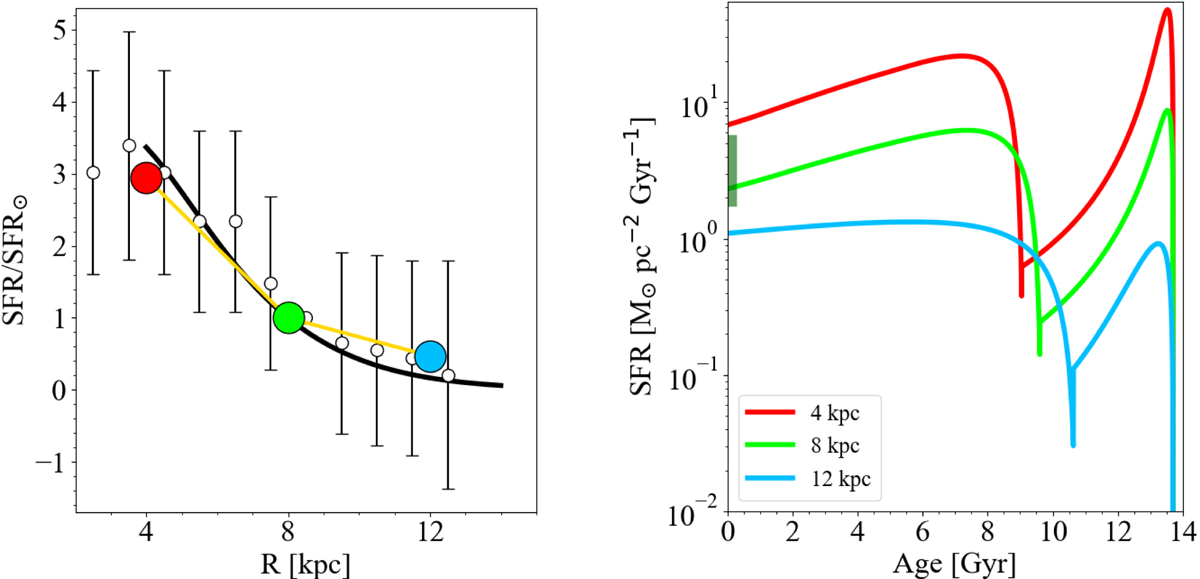
Left panel: observed and predicted radial SFR density gradient relative to the solar neighbourhood. The model results are the big solid circles connected by a solid yellow line. The black line is the analytical form suggested by Green (2014) for the Milky Way SFR profile. The open circles with error bars are observational data from Rana (1991). Right panel: SFR evolution predicted by our best fit models computed at 4, 8, and 12 kpc. The dark green shaded area indicates the present-day measured range in the solar annulus by Prantzos et al. (2018).
Current usage metrics show cumulative count of Article Views (full-text article views including HTML views, PDF and ePub downloads, according to the available data) and Abstracts Views on Vision4Press platform.
Data correspond to usage on the plateform after 2015. The current usage metrics is available 48-96 hours after online publication and is updated daily on week days.
Initial download of the metrics may take a while.