Fig. 10.
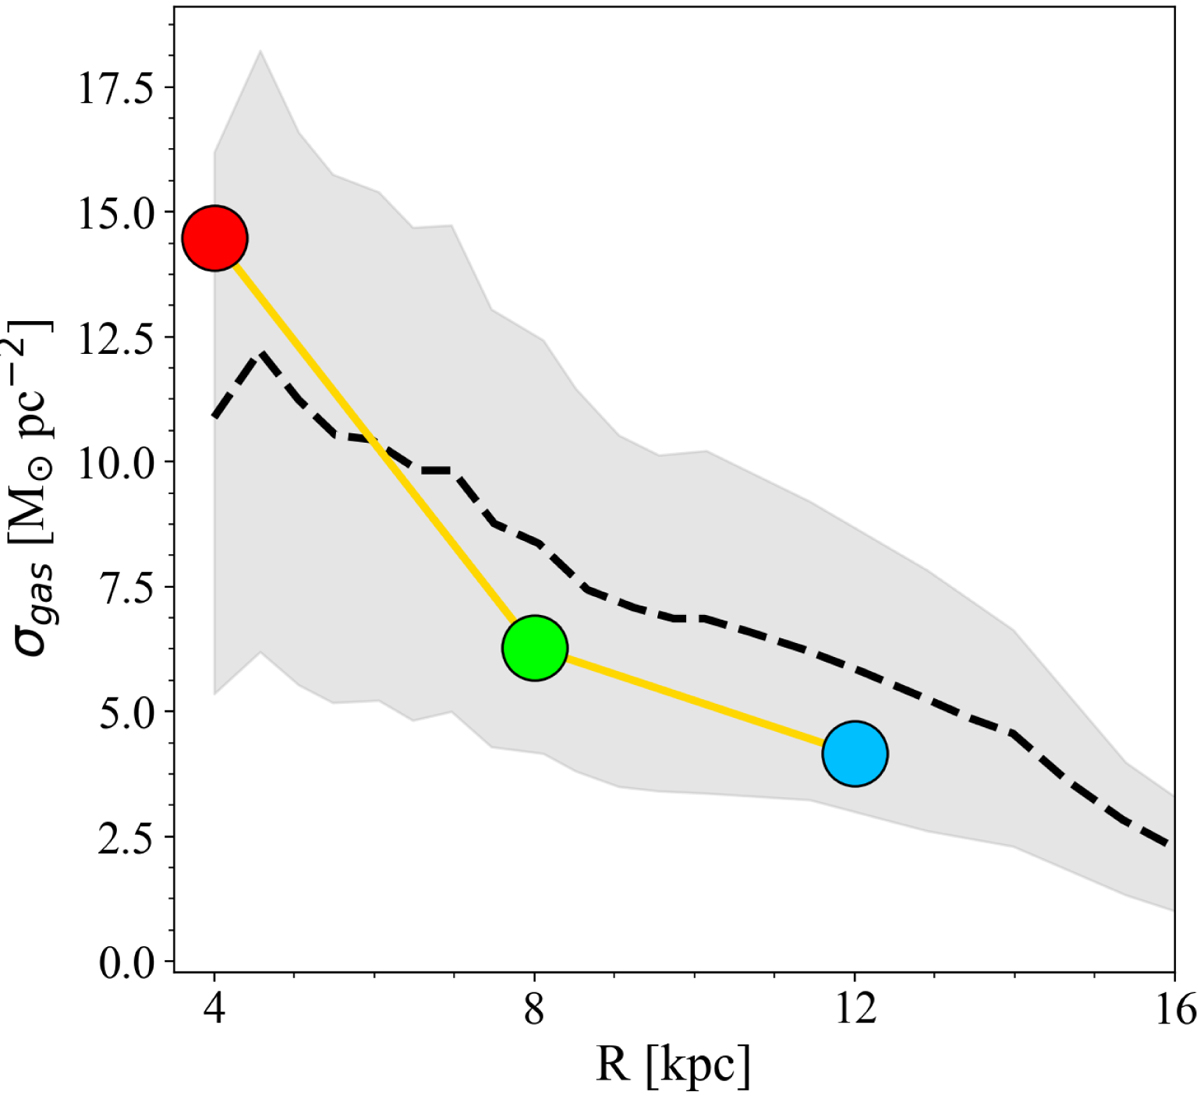
Observed and predicted radial gas surface density gradient. The black dashed curve is the average between the Dame (1993) and Nakanishi & Sofue (2003, 2006) data sets. The grey shaded region represents the typical uncertainty at each radius, for which we adopt either 50% of the average (see Nakanishi & Sofue 2006) or half the difference between the minimum and maximum values in each radial bin (if larger). The big filled circles show the model predictions.
Current usage metrics show cumulative count of Article Views (full-text article views including HTML views, PDF and ePub downloads, according to the available data) and Abstracts Views on Vision4Press platform.
Data correspond to usage on the plateform after 2015. The current usage metrics is available 48-96 hours after online publication and is updated daily on week days.
Initial download of the metrics may take a while.