Free Access
Fig. 4.
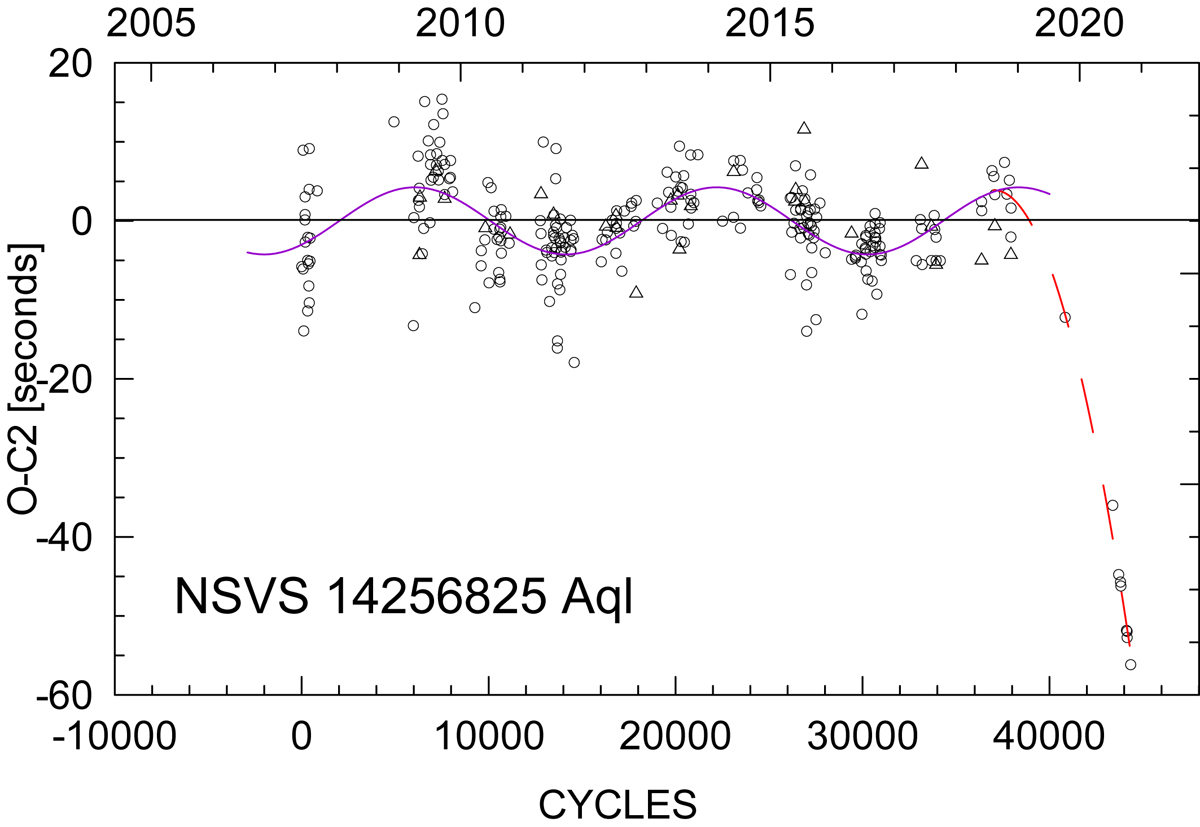
O–C2 diagram for N1425 after subtraction of a sinusoidal term of the possible third body. The violet curve represents additional cyclic variations with a period of about 5 years and an amplitude of 4 sec. The present rapid period decrease is denoted by red dashed curve.
Current usage metrics show cumulative count of Article Views (full-text article views including HTML views, PDF and ePub downloads, according to the available data) and Abstracts Views on Vision4Press platform.
Data correspond to usage on the plateform after 2015. The current usage metrics is available 48-96 hours after online publication and is updated daily on week days.
Initial download of the metrics may take a while.