Fig. 3.
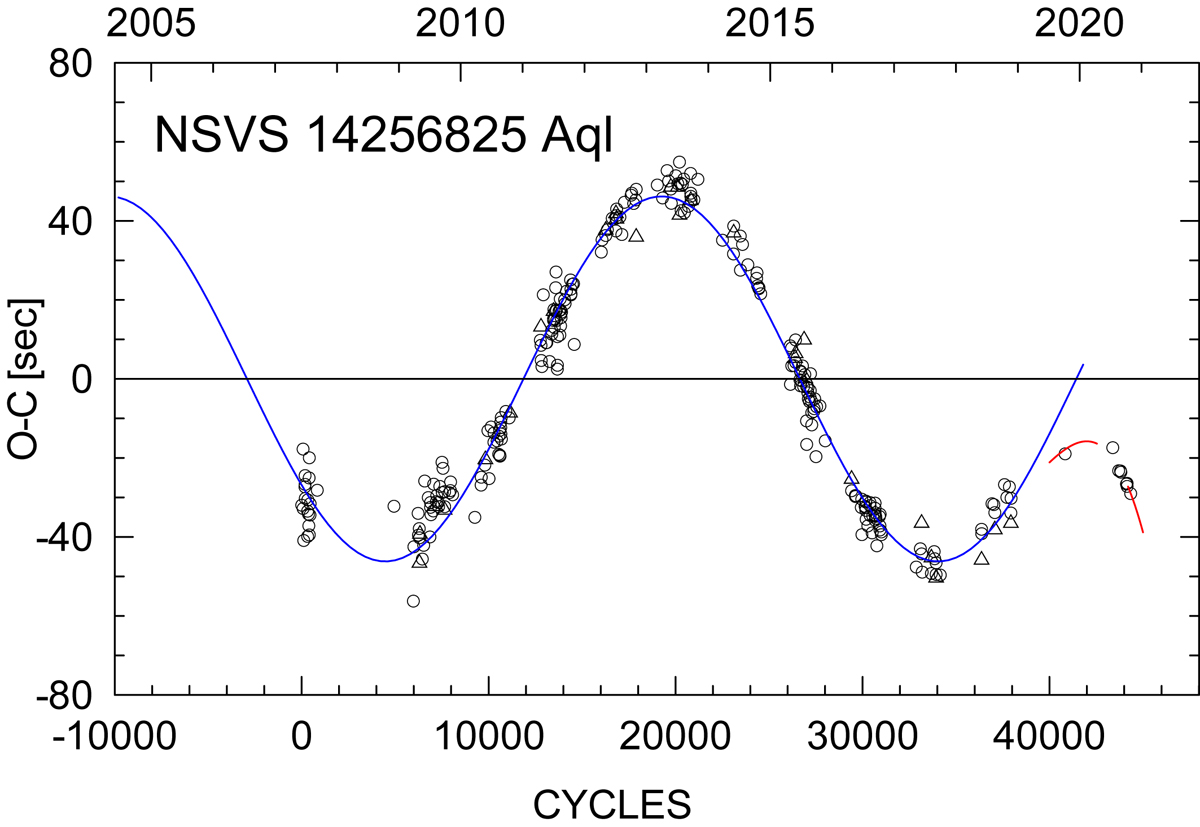
Actual O–C diagram for the eclipse times of N1425 (the last minimum obtained in November 2020). The individual primary minima are denoted by circles, the secondary by triangles. The blue sinusoidal curve with the short period of about 14 years clearly fits all data up to the epoch 40 000 (September 2019), but it does not follow the last mid-eclipse times measured after this date (red dashed curve).
Current usage metrics show cumulative count of Article Views (full-text article views including HTML views, PDF and ePub downloads, according to the available data) and Abstracts Views on Vision4Press platform.
Data correspond to usage on the plateform after 2015. The current usage metrics is available 48-96 hours after online publication and is updated daily on week days.
Initial download of the metrics may take a while.