Fig. 2.
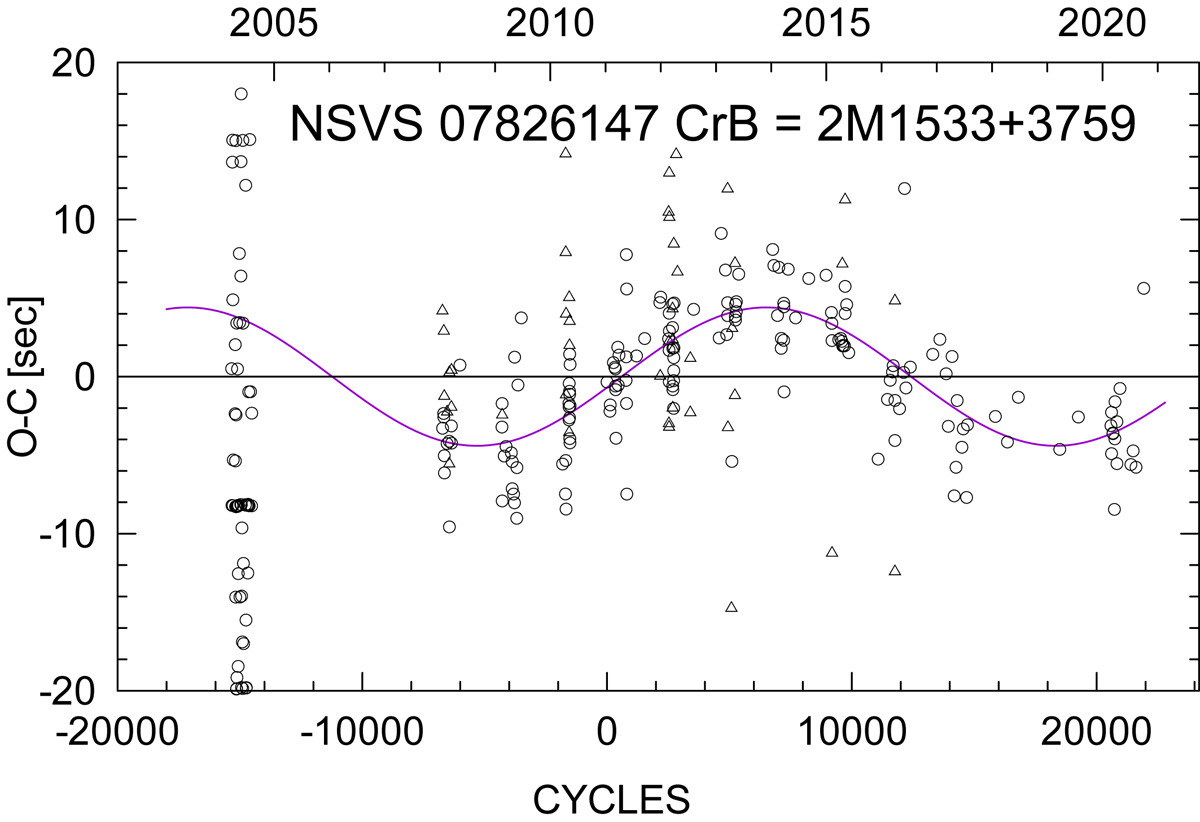
Present O–C diagram for the eclipse times of N782. The sinusoidal curve represents the LITE with the short period of about ten years and a very small semi-amplitude of 4.3 sec. The individual primary minima are denoted by circles, the secondary by triangles. The first group of mid-eclipse times close to the cycle −15 000 derived by Lohr et al. (2014) from the SuperWASP database was not taken in consideration due to the large scatter of these data.
Current usage metrics show cumulative count of Article Views (full-text article views including HTML views, PDF and ePub downloads, according to the available data) and Abstracts Views on Vision4Press platform.
Data correspond to usage on the plateform after 2015. The current usage metrics is available 48-96 hours after online publication and is updated daily on week days.
Initial download of the metrics may take a while.