Fig. 1.
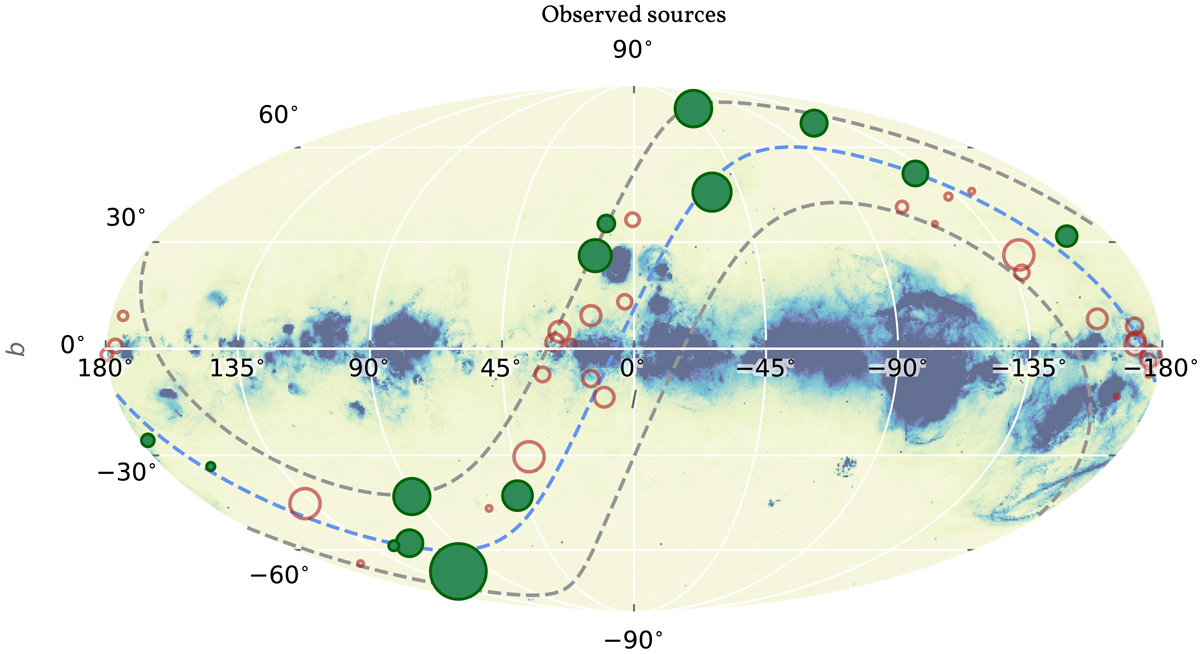
Sky distribution in Galactic coordinates of selected (filled green circles) and rejected (unfilled red circles) pulsars from the lists in Tables 1 and B.1. Larger markers denote a higher (median) precision of the measured DM. The dashed blue line marks the ecliptic, and the dashed gray lines show a region of ±20° from the ecliptic. The background shows the merged all-sky Hα map from Finkbeiner (2003).
Current usage metrics show cumulative count of Article Views (full-text article views including HTML views, PDF and ePub downloads, according to the available data) and Abstracts Views on Vision4Press platform.
Data correspond to usage on the plateform after 2015. The current usage metrics is available 48-96 hours after online publication and is updated daily on week days.
Initial download of the metrics may take a while.