Fig. 9.
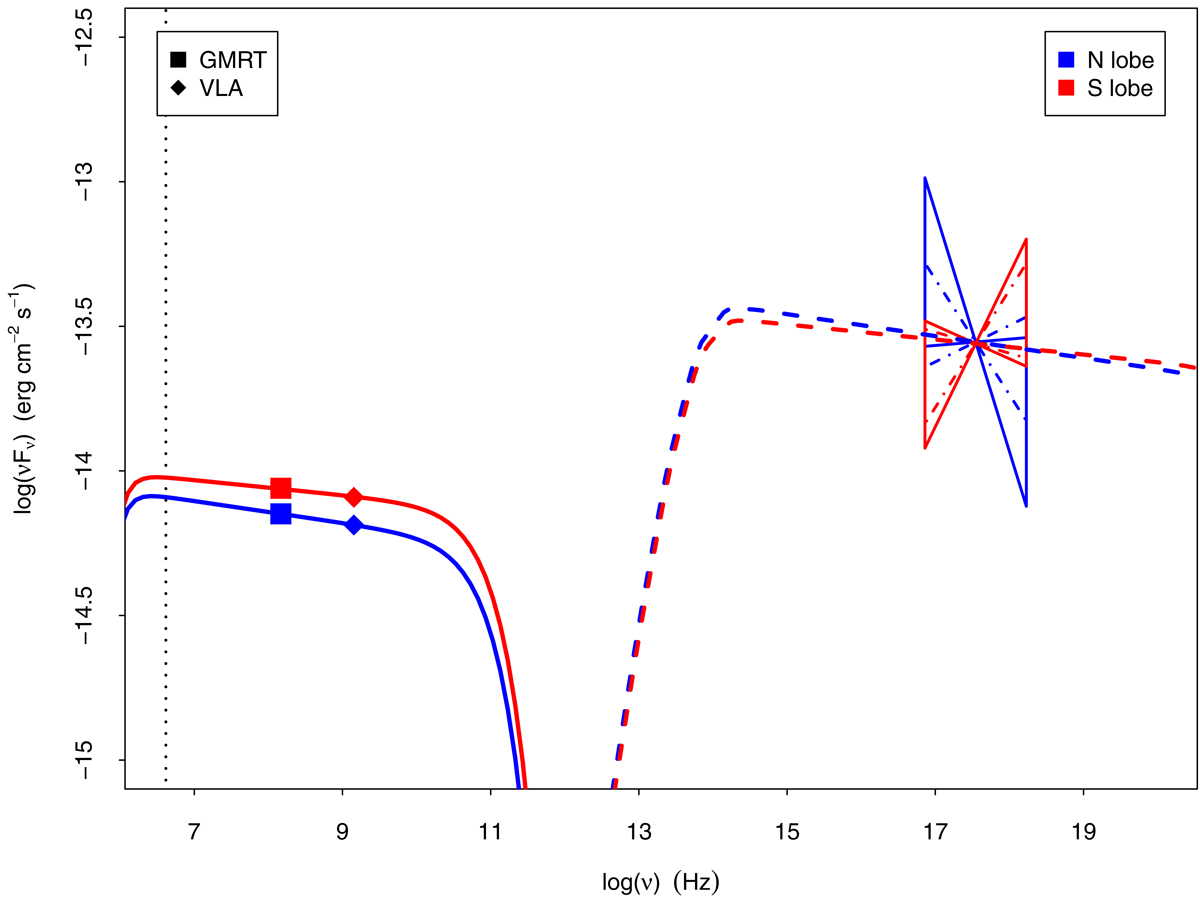
Observed SED (νFν) of N (in blue) and S (in red) lobes of 3C 187. Squares represent GMRT fluxes and diamonds represent VLA fluxes. The butterflies indicate the uncertainties on the spectral indices obtained from the power-law fits in the lobes (see Sect. 4.1). The full line butterflies represent the spectral indices obtained with the background subtraction, while the dot-dashed butterflies represent the spectral indices obtained with the background modeling. The full lines represent the simulation of the synchrotron emission, while the dashed lines represent the IC/CMB emission in the same region. The vertical dotted line marks the frequency (∼4 MHz) obtained from Eq. (1) at which the electrons responsible for the IC/CMB radiation at 1 keV emit synchrotron radiation given the magnetic field values shown in Table 4.
Current usage metrics show cumulative count of Article Views (full-text article views including HTML views, PDF and ePub downloads, according to the available data) and Abstracts Views on Vision4Press platform.
Data correspond to usage on the plateform after 2015. The current usage metrics is available 48-96 hours after online publication and is updated daily on week days.
Initial download of the metrics may take a while.