Fig. 8.
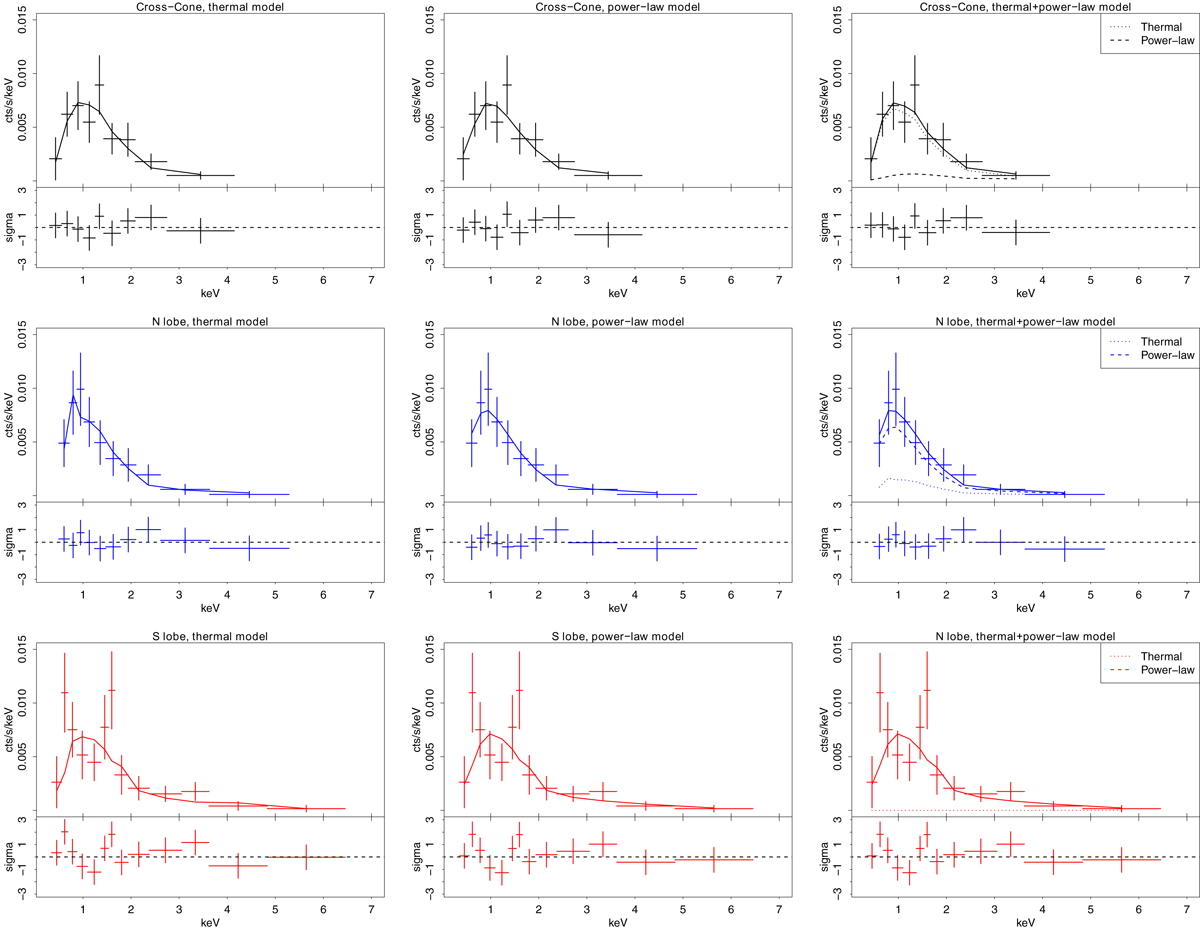
Spectral fits in the 0.3 − 7 keV band performed with a thermal XSAPEC (left column), power-law (central column), and mixed thermal+power-law (right column) models. From top to bottom we show spectra extracted in the cross cone, N lobe, and S lobe regions. In upper portion of each panel the full line represents the best-fit model and the crosses represent the data points, while the residual distribution is presented in the lower portion of each panel. For the thermal+power-law model (right column), the dotted line represents the thermal component, the dashed line represents the power-law component, and the full line represents the total model.
Current usage metrics show cumulative count of Article Views (full-text article views including HTML views, PDF and ePub downloads, according to the available data) and Abstracts Views on Vision4Press platform.
Data correspond to usage on the plateform after 2015. The current usage metrics is available 48-96 hours after online publication and is updated daily on week days.
Initial download of the metrics may take a while.