Fig. 7.
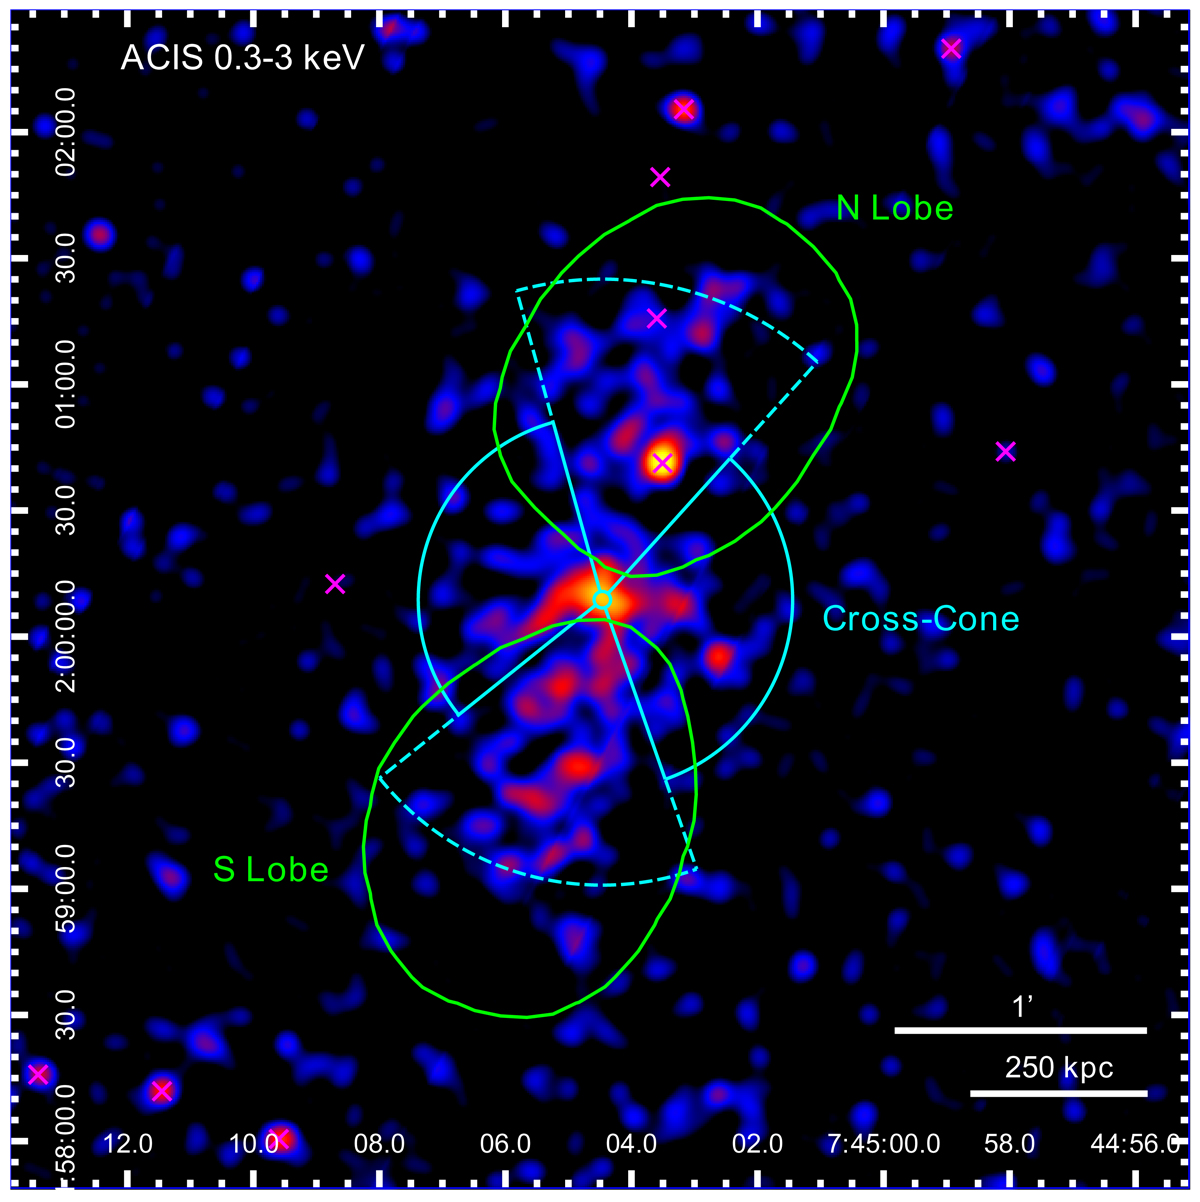
Soft band 0.3 − 3 keV ACIS-S flux image smoothed with a Gaussian kernel with a 5 × 5 pixel (![]() ) σ, with superimposed the regions used for spectral extraction. The cyan lines (full for the cross-cone directions and dashed for the N and S directions) represent the cones in which the soft X-ray emission extends with a signal-to-noise ratio of at least 3 (see Fig. 6). The green lines represent the contour level at 30 times the rms level for the 150 MHz (see Fig. 3) maps. The magenta xs represent the detected X-ray sources, excluded from the spectral extraction.
) σ, with superimposed the regions used for spectral extraction. The cyan lines (full for the cross-cone directions and dashed for the N and S directions) represent the cones in which the soft X-ray emission extends with a signal-to-noise ratio of at least 3 (see Fig. 6). The green lines represent the contour level at 30 times the rms level for the 150 MHz (see Fig. 3) maps. The magenta xs represent the detected X-ray sources, excluded from the spectral extraction.
Current usage metrics show cumulative count of Article Views (full-text article views including HTML views, PDF and ePub downloads, according to the available data) and Abstracts Views on Vision4Press platform.
Data correspond to usage on the plateform after 2015. The current usage metrics is available 48-96 hours after online publication and is updated daily on week days.
Initial download of the metrics may take a while.