Fig. 6.
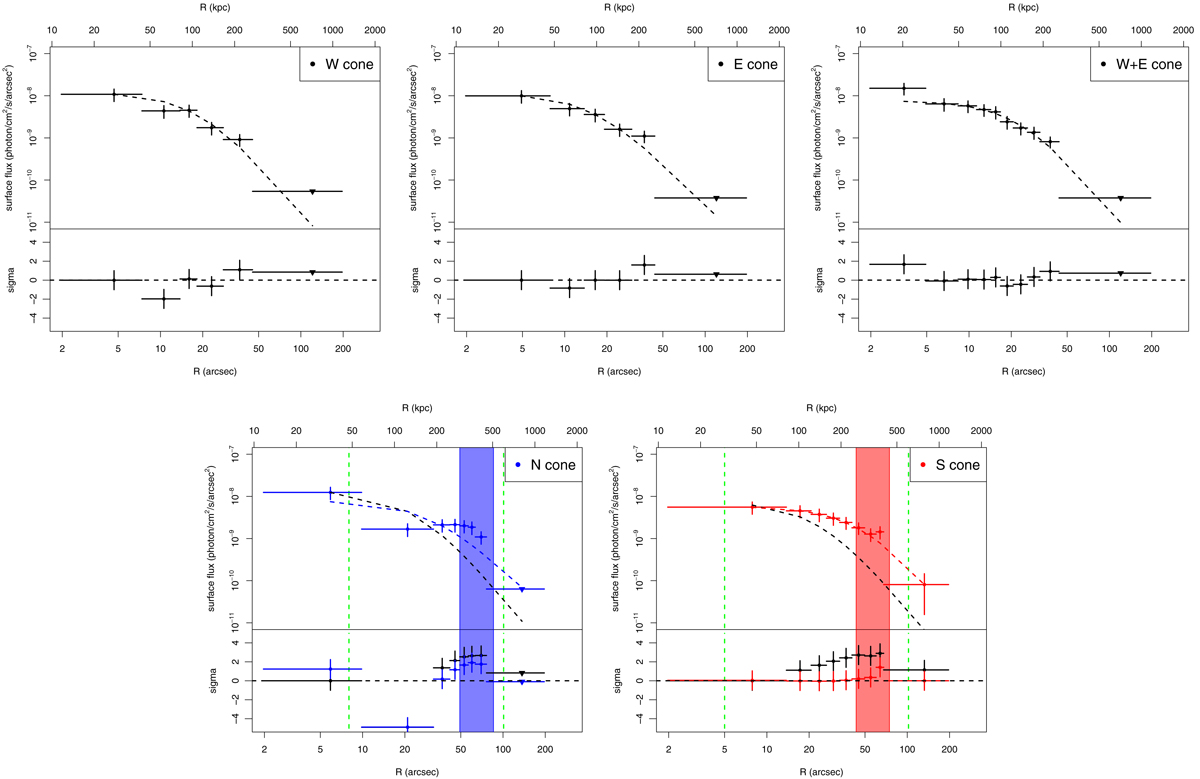
Surface flux profiles in the 0.3 − 3 keV band extracted in the E cone (upper left panel), W cone (upper central panel), W+E cone (upper right panel), N cone (lower left panel), and S cone (lower right panel) directions (see Fig. 5). The widths of the bins are adaptively chosen to reach a minimum signal-to-noise ratio of 3. Upper limits are indicated with downward triangles. For the upper panels the dashed black lines represent the best-fit beta model the profiles. For the lower panels, the black dashed lines represent the best-fit beta model to the E+W cone, normalized to match the first bin. The vertical green dashed lines indicate the locations of the contour level at 30 times the rms level for 150 MHz map, while the colored vertical areas denote the locations of the contour level at 30 times the rms level for the VLA 1.4 GHz (see Fig. 5). The colored dashed lines represent the best-fit beta model the profiles, excluding the bins in the colored vertical area. The residuals to such fits are indicated at the bottom of each panel.
Current usage metrics show cumulative count of Article Views (full-text article views including HTML views, PDF and ePub downloads, according to the available data) and Abstracts Views on Vision4Press platform.
Data correspond to usage on the plateform after 2015. The current usage metrics is available 48-96 hours after online publication and is updated daily on week days.
Initial download of the metrics may take a while.