Fig. 4.
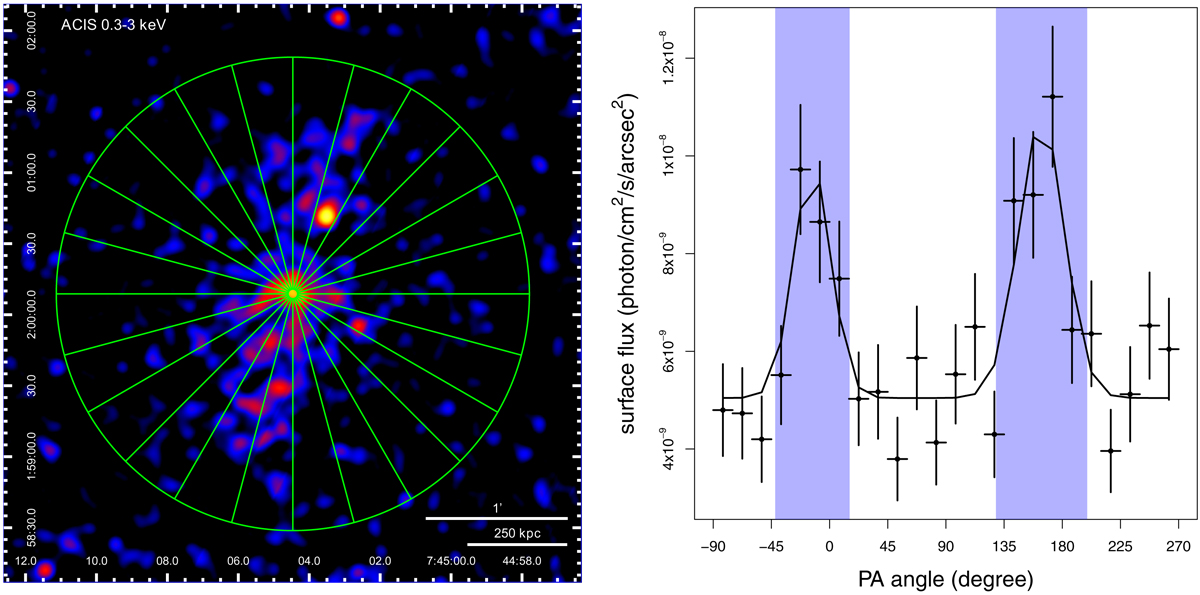
Left panel: soft band 0.3 − 3 keV ACIS-S flux image smoothed with a Gaussian kernel with a 5 × 5 pixel (![]() ) σ, with the angular sectors used for the azimuthal profile extraction superimposed in green. Right panel: black points indicate the surface flux profile in the 0.3 − 3 keV band extracted in the sectors shown in the left panel; the vertical black bars indicate the uncertainties on the surface flux and the horizontal black bars indicate the bin widths. The full black line represents the best-fit model, comprising two Gaussians plus a constant to account for the background level, for the profile; the blue shaded areas represent the regions chosen for the N and S cone regions, that is, the angles comprised between two standard deviations from each Gaussian peak.
) σ, with the angular sectors used for the azimuthal profile extraction superimposed in green. Right panel: black points indicate the surface flux profile in the 0.3 − 3 keV band extracted in the sectors shown in the left panel; the vertical black bars indicate the uncertainties on the surface flux and the horizontal black bars indicate the bin widths. The full black line represents the best-fit model, comprising two Gaussians plus a constant to account for the background level, for the profile; the blue shaded areas represent the regions chosen for the N and S cone regions, that is, the angles comprised between two standard deviations from each Gaussian peak.
Current usage metrics show cumulative count of Article Views (full-text article views including HTML views, PDF and ePub downloads, according to the available data) and Abstracts Views on Vision4Press platform.
Data correspond to usage on the plateform after 2015. The current usage metrics is available 48-96 hours after online publication and is updated daily on week days.
Initial download of the metrics may take a while.