Fig. 3.
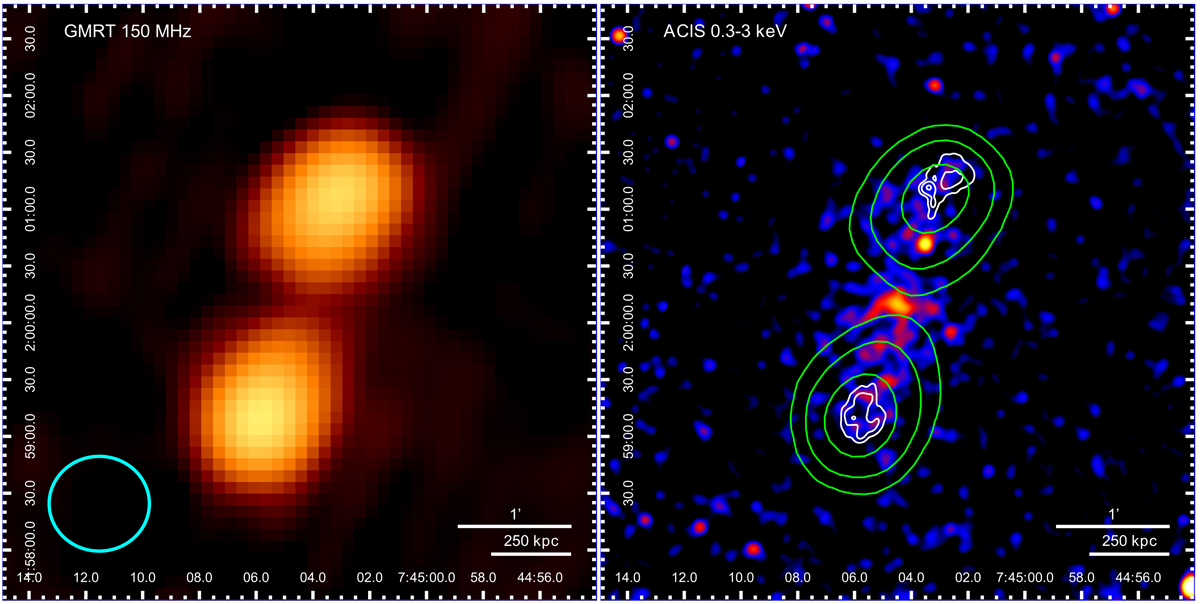
Left panel: archival GMRT 150 MHz image (http://tgssadr.strw.leidenuniv.nl/doku.php) of the central ∼5′ of 3C 187 obtained from the TGSS survey. The clean beam (shown in the lower left with a cyan ellipse) is ![]() with major axis P.A. = 0°), and the rms noise is 2.6 mJy per beam. Right panel: soft band 0.3 − 3 keV ACIS-S flux image smoothed with a Gaussian kernel with a 5 × 5 pixel (
with major axis P.A. = 0°), and the rms noise is 2.6 mJy per beam. Right panel: soft band 0.3 − 3 keV ACIS-S flux image smoothed with a Gaussian kernel with a 5 × 5 pixel (![]() ) σ, with superimposed in white VLA L band contours from the upper right panel of Fig. 2, while the green lines represent the GMRT 150 MHz contours starting at 30 times the rms level, increasing by factors of four.
) σ, with superimposed in white VLA L band contours from the upper right panel of Fig. 2, while the green lines represent the GMRT 150 MHz contours starting at 30 times the rms level, increasing by factors of four.
Current usage metrics show cumulative count of Article Views (full-text article views including HTML views, PDF and ePub downloads, according to the available data) and Abstracts Views on Vision4Press platform.
Data correspond to usage on the plateform after 2015. The current usage metrics is available 48-96 hours after online publication and is updated daily on week days.
Initial download of the metrics may take a while.