Fig. 10.
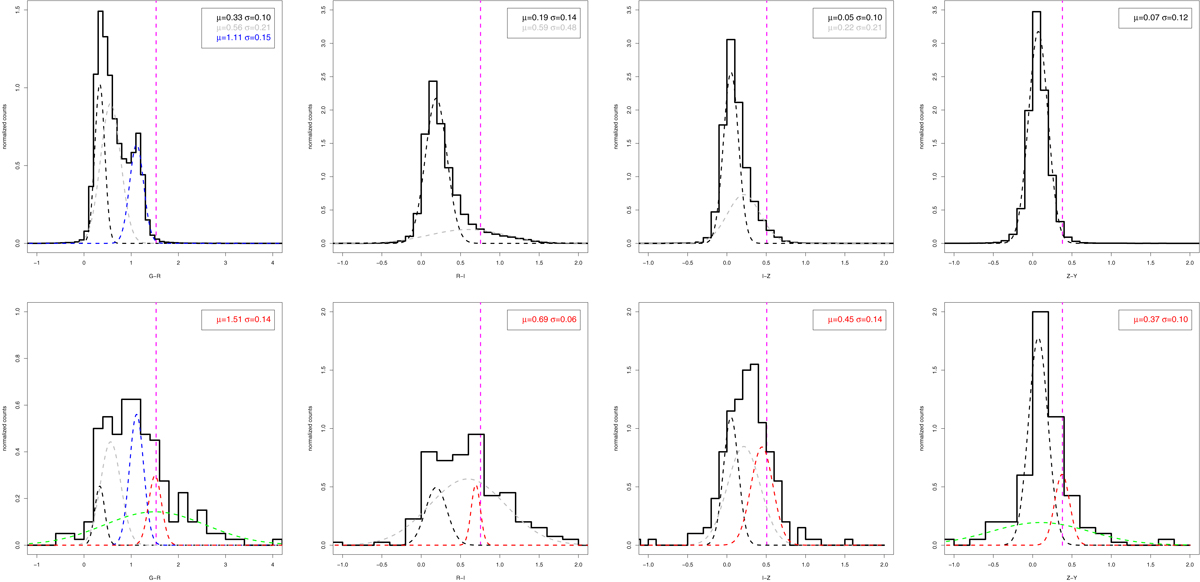
Upper panels: normalized distributions of the (de-reddened) colors for random Pan-STARRS sources. The vertical magenta line denotes the color of the 3C 187 core counterpart. The best-fit Gaussian components are overplotted with dashed lines of different colors, with the best-fit μ and σ indicated in the legend. Lower panels: normalized distributions of the (de-reddened) colors for Pan-STARRS sources in the field of 3C 187. As in the upper panels, the vertical magenta line indicates the color of the 3C 187 core counterpart. The color distributions are modeled with the same Gaussians used to model the random source distribution with fixed μ and σ. The additional component required to model the color distributions is indicated with a red dashed line, with the best-fit μ and σ indicated in the legend. The g − r and z − y colors require a further broad, subdominant component indicated with a green dashed line.
Current usage metrics show cumulative count of Article Views (full-text article views including HTML views, PDF and ePub downloads, according to the available data) and Abstracts Views on Vision4Press platform.
Data correspond to usage on the plateform after 2015. The current usage metrics is available 48-96 hours after online publication and is updated daily on week days.
Initial download of the metrics may take a while.