Fig. 5.
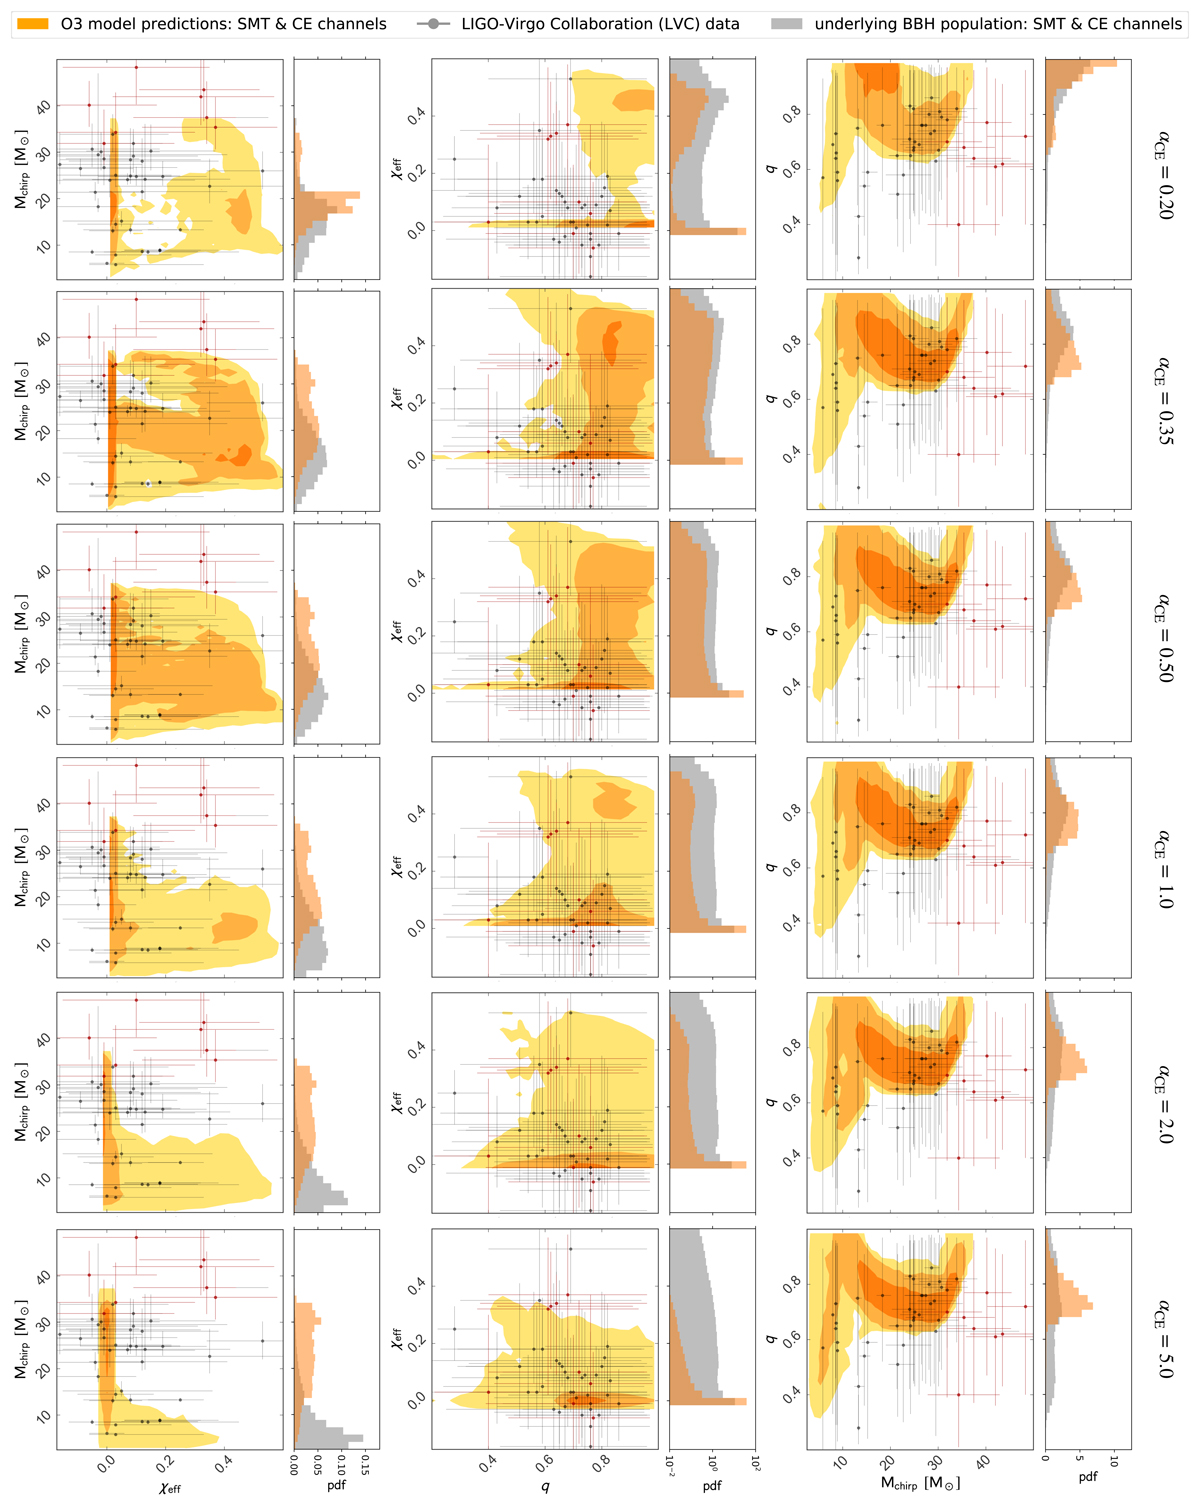
Model predictions for the O3 detected BBH population of CE and SMT channels combined for αCE ∈ [0.2, 0.35, 0.5, 1.0, 2.0, 5.0] and ηacc = 1, in orange. We show the joint distributions of chirp mass Mchirp, effective inspiral spin parameter χeff and binary mass ratio q. Lighter colours represent larger contour levels of 68%, 95% and 99%, respectively, constructed with pygtc (Bocquet & Carter 2016). All histograms are plotted with 30 bins without any bin smoothing. We overlaid in grey the LVC GWTC-2 data with their 90% credible intervals. The 9 events of GWTC-2 in tension with our models are indicated in red (see Sect. 3.3). We also show the one-dimensional projection of each quantity overplotted on the underlying (intrinsic) BBH population, in grey. For visualisation purposes, the χeff probability density function (pdf) is plotted in log-scale. For a visualisation of each model separately see Appendix G.
Current usage metrics show cumulative count of Article Views (full-text article views including HTML views, PDF and ePub downloads, according to the available data) and Abstracts Views on Vision4Press platform.
Data correspond to usage on the plateform after 2015. The current usage metrics is available 48-96 hours after online publication and is updated daily on week days.
Initial download of the metrics may take a while.