Fig. A.2
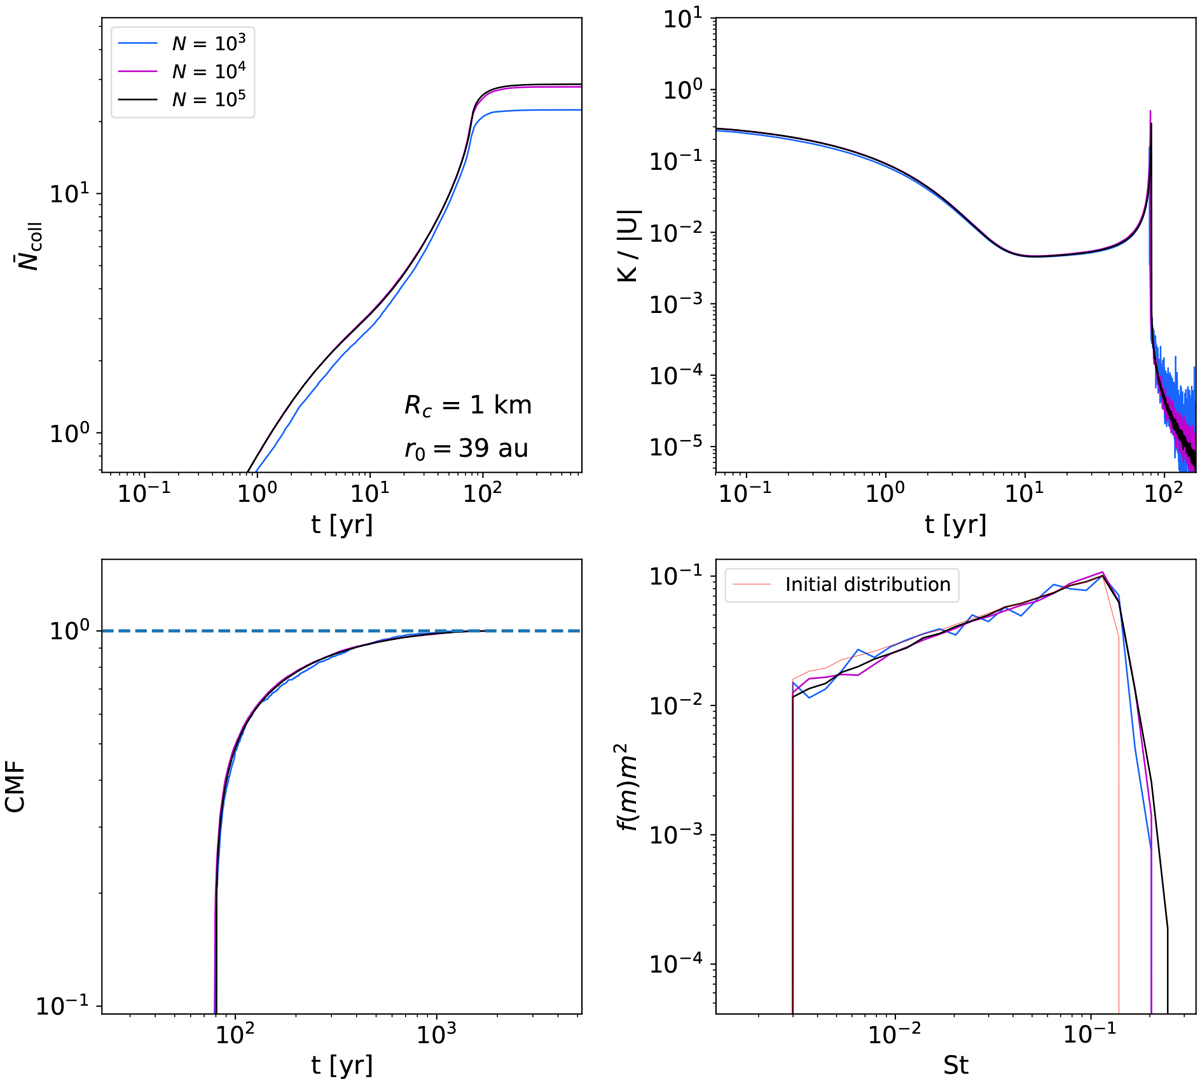
Convergence test for the fiducial model for different number of representative pebbles N. Top left panel: average collisions per pebble in time. Top right panel: ratio of the kinetic to potential energy K∕|U| of the cloud in time. The results are the same for increasing N already at N = 104. Bottom left panel: CMF (settled pebbles) in time. Results are the same for all N. Bottom right panel: mass distribution function vs. the radius (Stokes number) of the pebbles of the final core.
Current usage metrics show cumulative count of Article Views (full-text article views including HTML views, PDF and ePub downloads, according to the available data) and Abstracts Views on Vision4Press platform.
Data correspond to usage on the plateform after 2015. The current usage metrics is available 48-96 hours after online publication and is updated daily on week days.
Initial download of the metrics may take a while.