Fig. 6
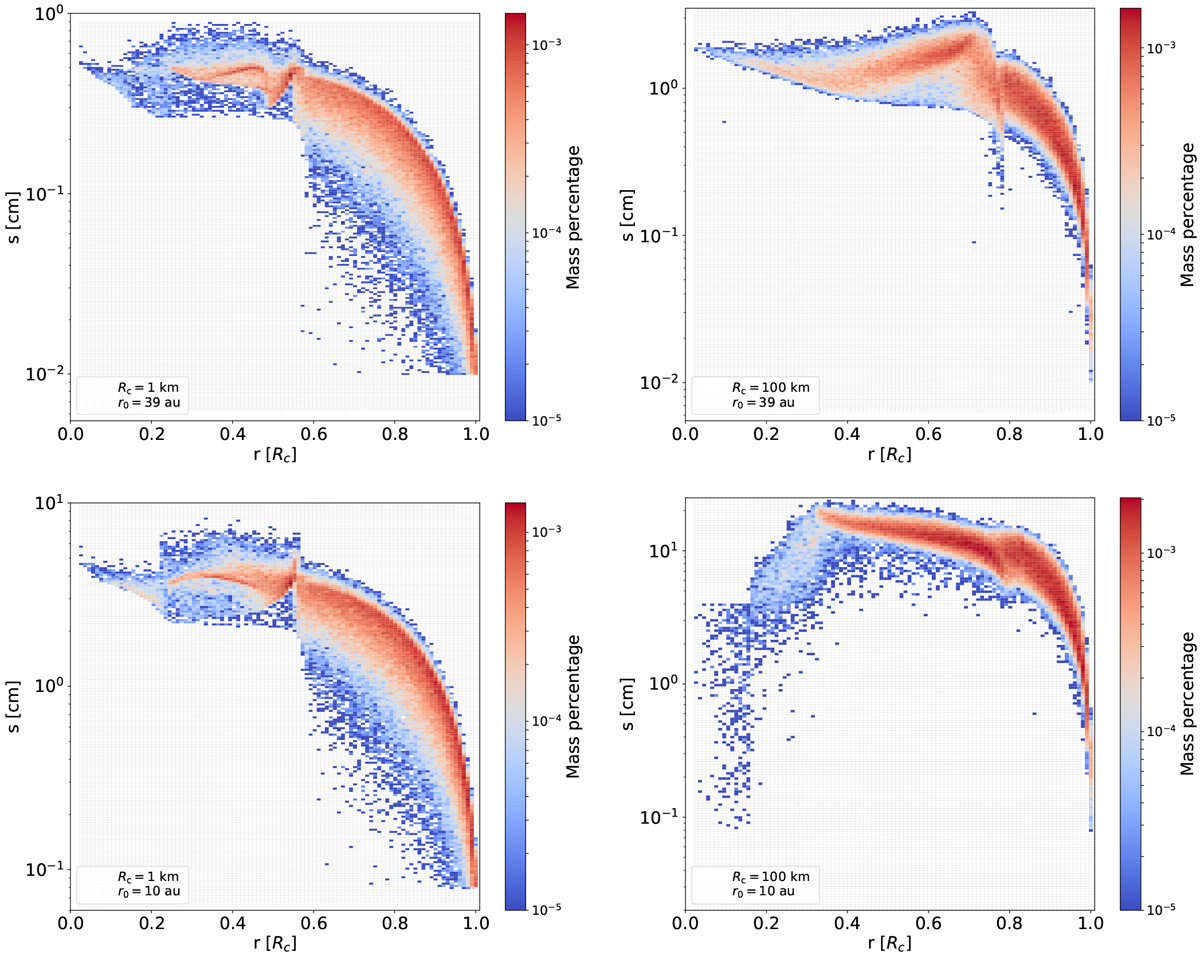
Contributions to the total core mass for 1 and 100 km at 39 au (upper left and right respectively) and 1 and 100 km at 10 au (bottom left and right respectively) for a high resolution run of N = 105 pebble swarms. The y-axis indicates thesize range of pebbles and the x-axis the distance from the core center. All the pebbles in a certain pixel with width Δr and height Δs are counted and weighted with respect to Mt, the total core mass. The mass contribution is shown by the color bar.
Current usage metrics show cumulative count of Article Views (full-text article views including HTML views, PDF and ePub downloads, according to the available data) and Abstracts Views on Vision4Press platform.
Data correspond to usage on the plateform after 2015. The current usage metrics is available 48-96 hours after online publication and is updated daily on week days.
Initial download of the metrics may take a while.