Fig. 6.
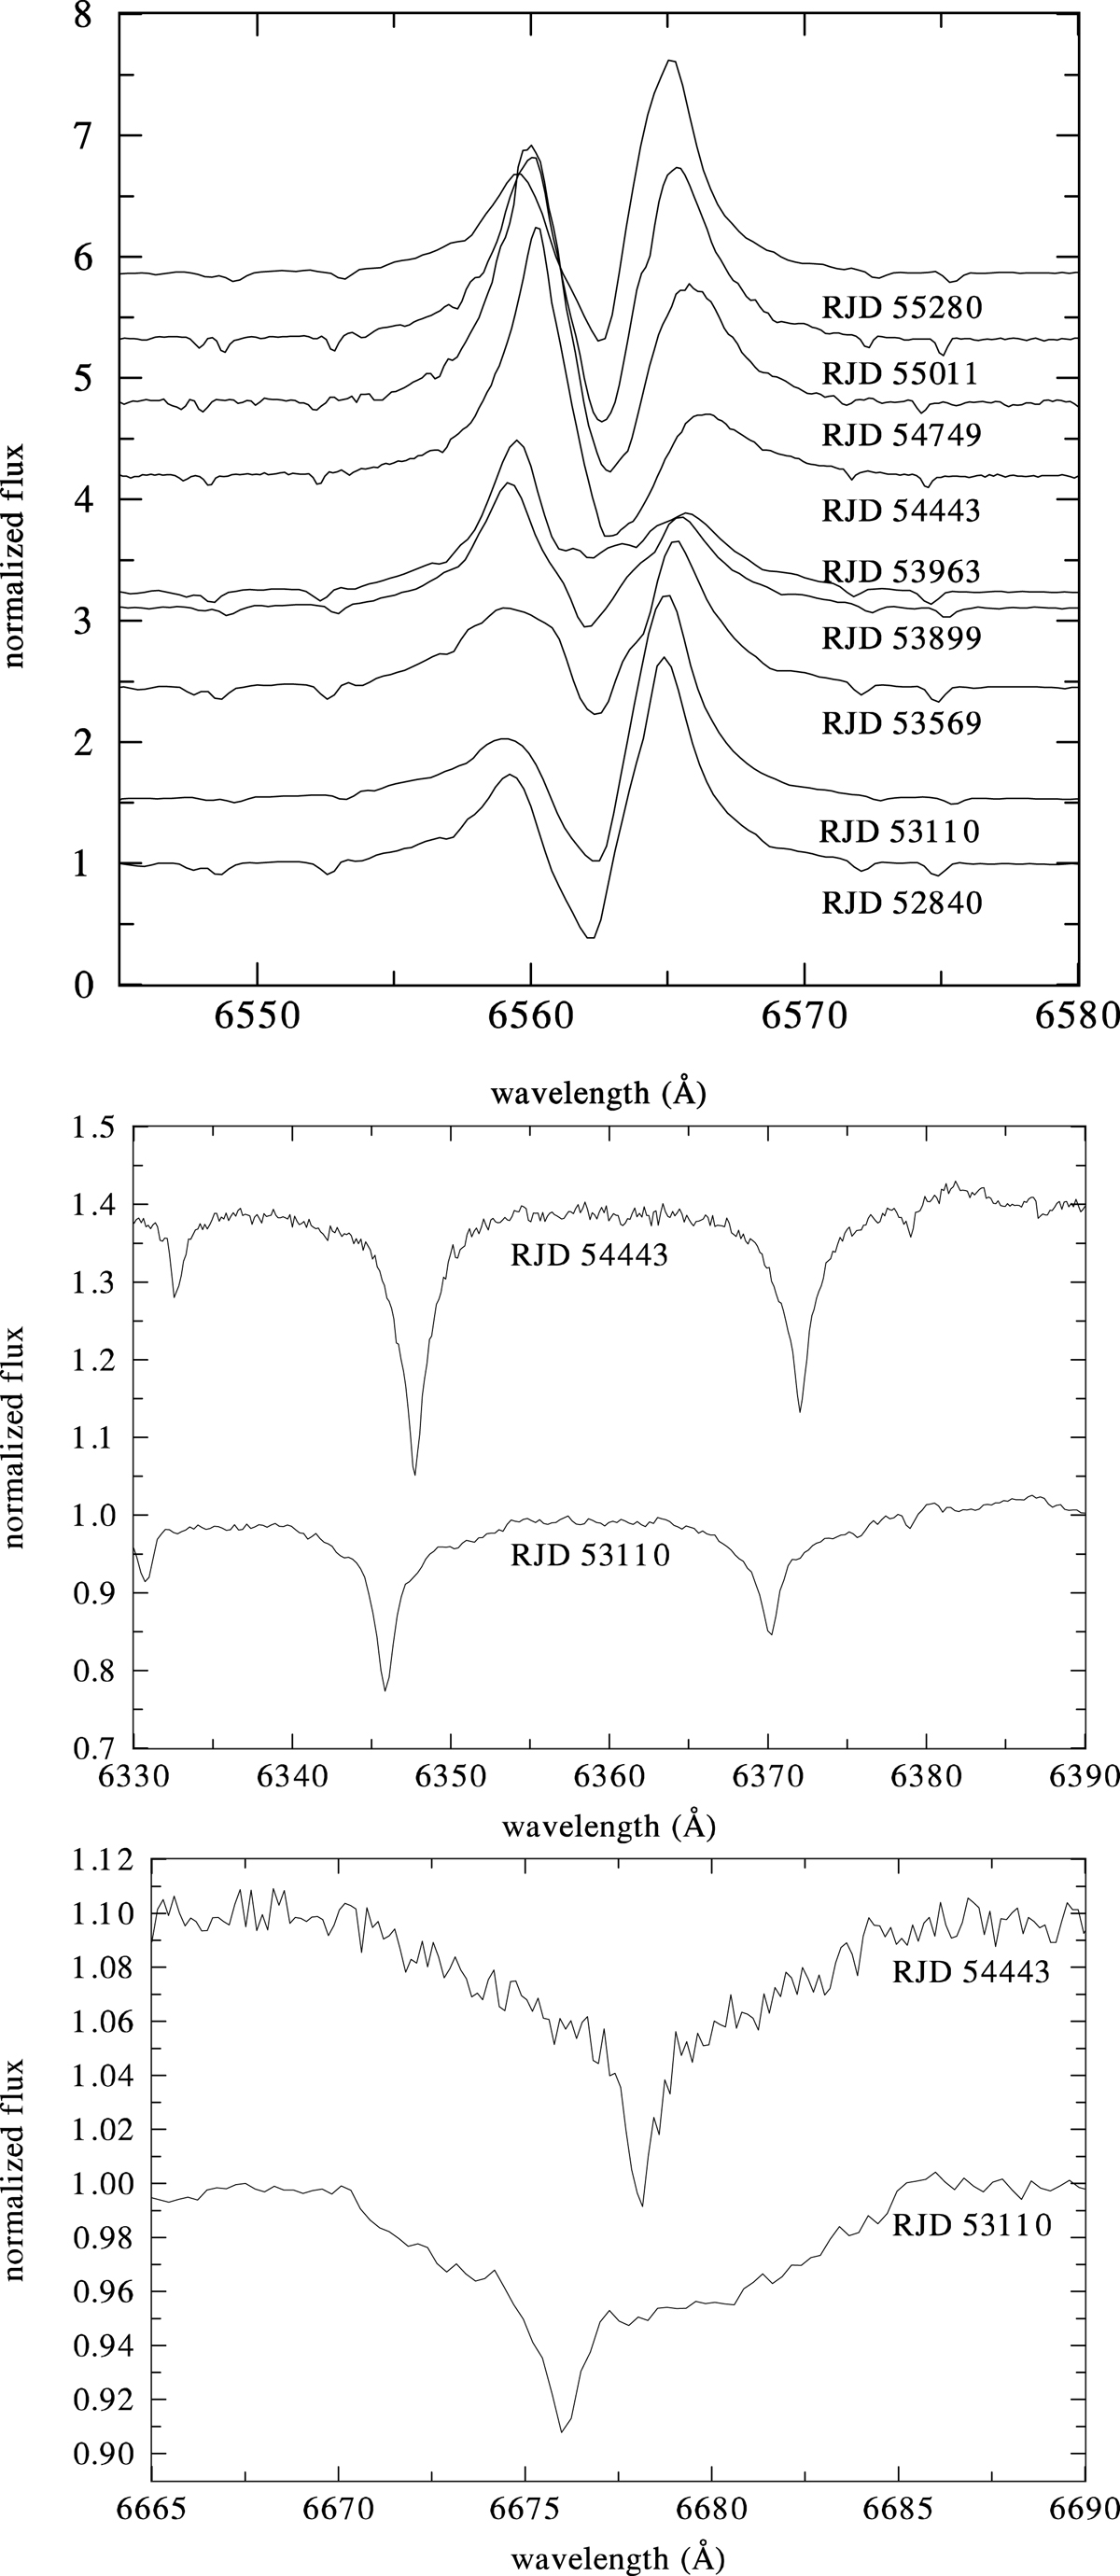
Selected line profiles. Top: sequence of Hα profiles over one whole 2400 d cycle. Shifts of continua in ordinate are scaled in such a way to correspond to differences of individual spectra in RJD. Middle and bottom panels: comparison of two DAO Si II, and He I line profiles from the two consecutive extrema of the long-term V/R changes.
Current usage metrics show cumulative count of Article Views (full-text article views including HTML views, PDF and ePub downloads, according to the available data) and Abstracts Views on Vision4Press platform.
Data correspond to usage on the plateform after 2015. The current usage metrics is available 48-96 hours after online publication and is updated daily on week days.
Initial download of the metrics may take a while.