Fig. 5.
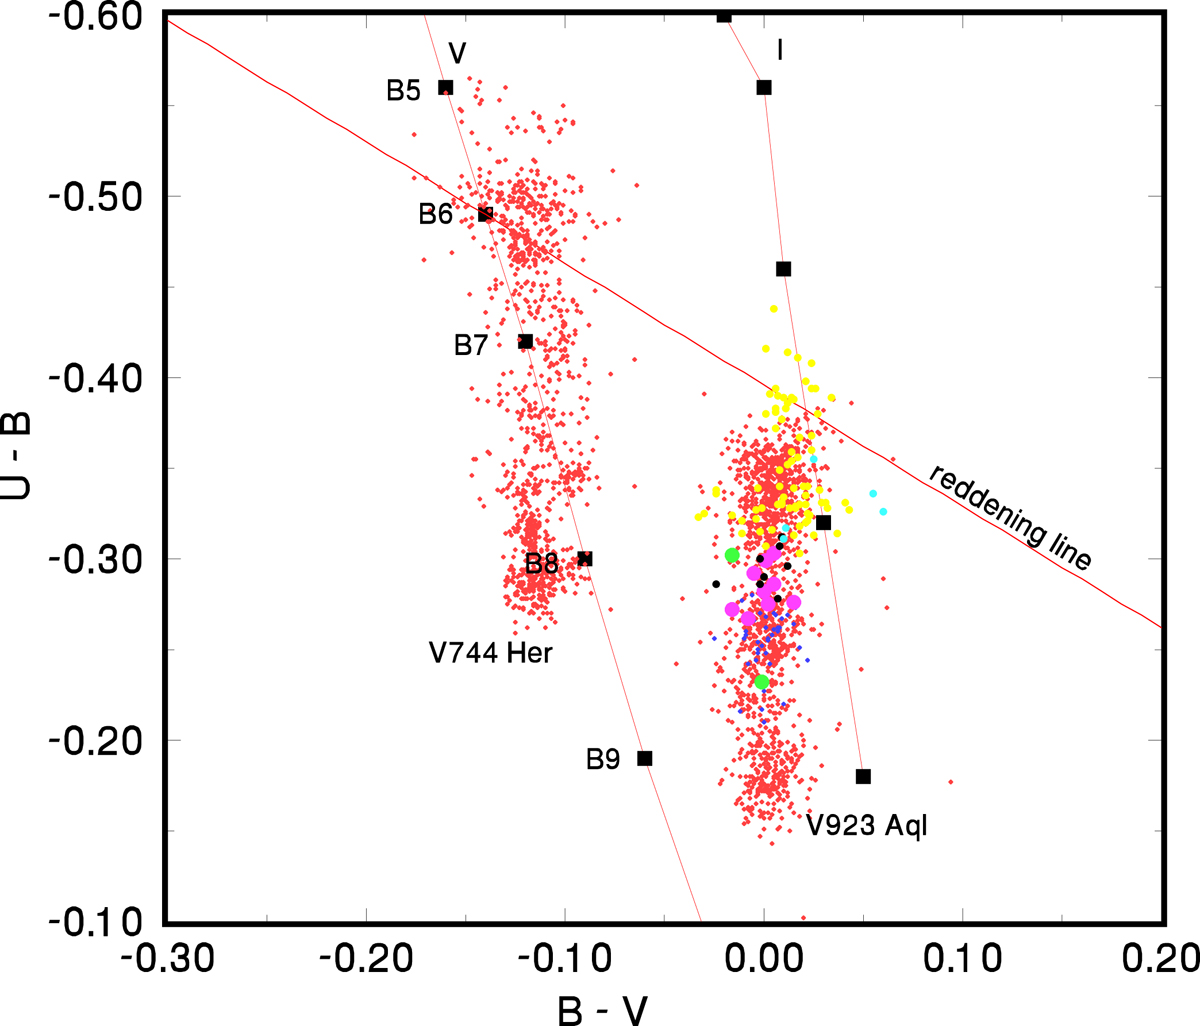
U − B vs. B − V colour diagram showing the secular changes of V923 Aql. The object is reddened and moves along the main sequence. This is indicative of an inverse correlation between the brightness and emission-line strength. The data from different observatories are distinguished by different colours as follows: Hvar = red, SPM = blue, Tug = magenta, Canakkale = yellow, Haute Provence = black, Geneve = green, and Ondřejov = cyan. For comparison, the Hvar photometric observations of another systematically studied Be star V744 Her = 88 Her are also shown. They are less reddened but show a remarkably similar pattern of variations.
Current usage metrics show cumulative count of Article Views (full-text article views including HTML views, PDF and ePub downloads, according to the available data) and Abstracts Views on Vision4Press platform.
Data correspond to usage on the plateform after 2015. The current usage metrics is available 48-96 hours after online publication and is updated daily on week days.
Initial download of the metrics may take a while.