Fig. 3.
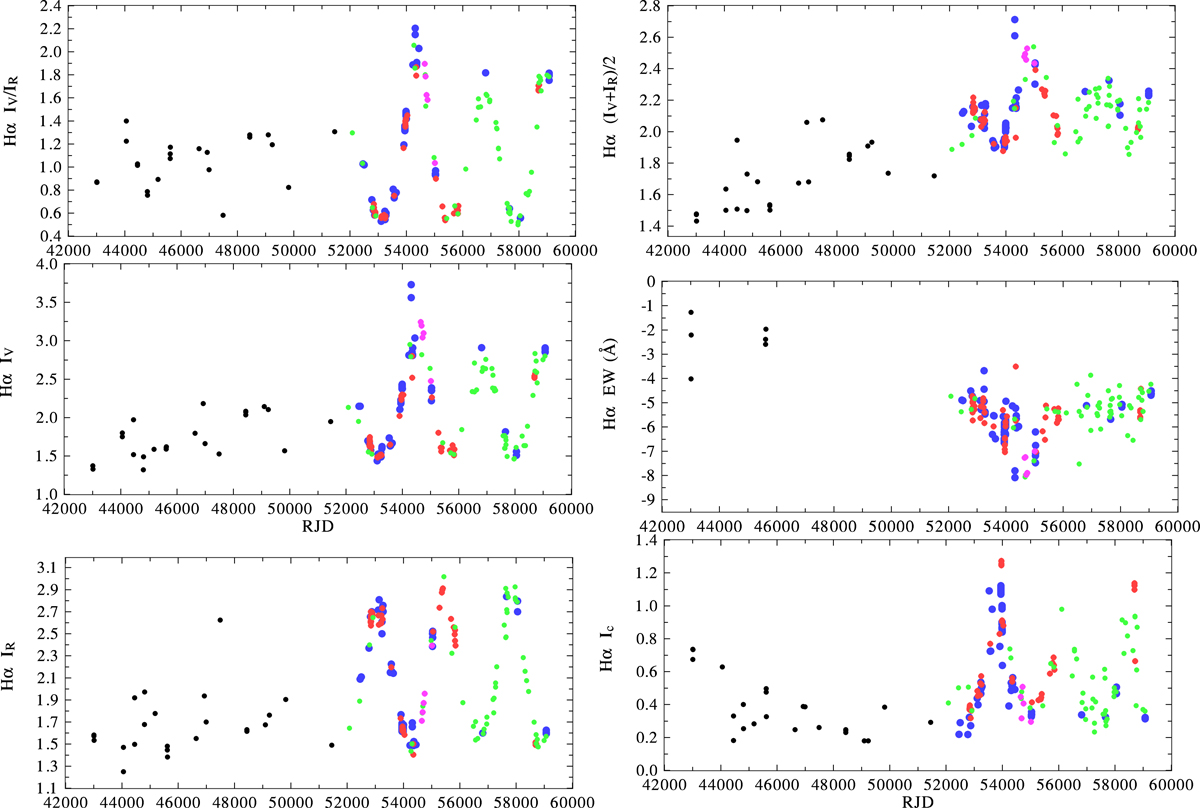
Long-term spectral variations of the Hα line profile. From top to bottom: left panels show the ratio of the violet and red emission peak strength, normalised flux of the V peak, and normalised flux of the R peak. Right panels show the mean of the normalised fluxes in the V and R peak, equivalent width of the whole line, and central intensity of the core absorption. Data from the higher-resolution Elodie, Feros, and DAO are shown by blue circles, those from OND by the red circles, those from the BeSS amateur spectra by the green circles, those from the Trieste spectra re-reduced by us by magenta circles, and those from the literature by the black circles.
Current usage metrics show cumulative count of Article Views (full-text article views including HTML views, PDF and ePub downloads, according to the available data) and Abstracts Views on Vision4Press platform.
Data correspond to usage on the plateform after 2015. The current usage metrics is available 48-96 hours after online publication and is updated daily on week days.
Initial download of the metrics may take a while.